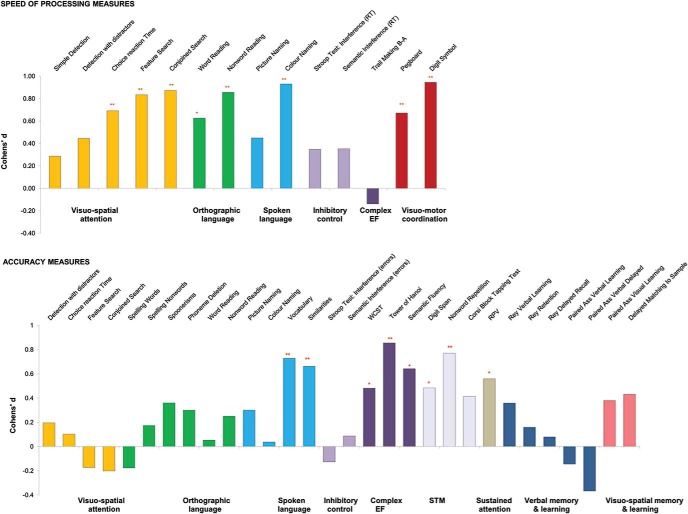
Figure 2.
Differences in performance of the PKU group from the control group in terms of Cohen’s d across functions; Cohen’s d = difference between the two groups averages divided by the pooled SD. Asterisks indicate a significant difference between AwPKU and Control. * p < 0.05. ** p < 0.01. See the online article for the color version of this figure.

