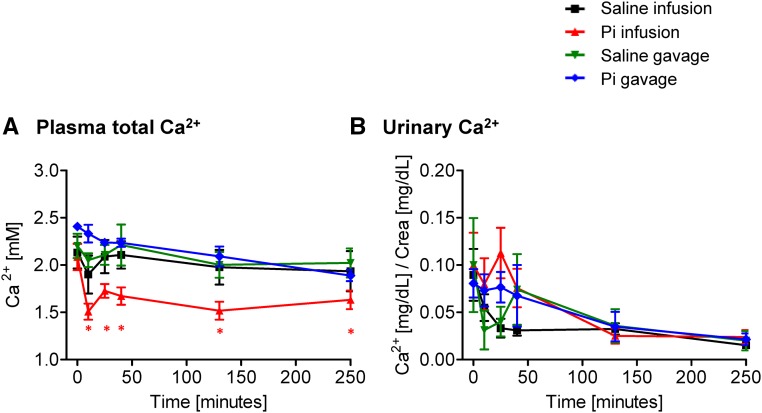
Figure 7.
Effect of intravenous and intragastric administration of Pi on Ca2+ plasma levels and urinary excretion in PTX rats. PTX rats were loaded with 500 μmol Pi or saline intravenously or orally. (A) Plasma Ca2+ and (B) urinary Ca2+/creatinine. Four profiles are shown: saline intravenous infusion (black), Pi intravenous infusion (red), saline intragastric gavage (green), and Pi intragastric gavage (blue). Data are presented as the means±SEM. ANOVA test; n=4–6 per group and time point. *P<0.05 versus time 0.

