Figure 2.
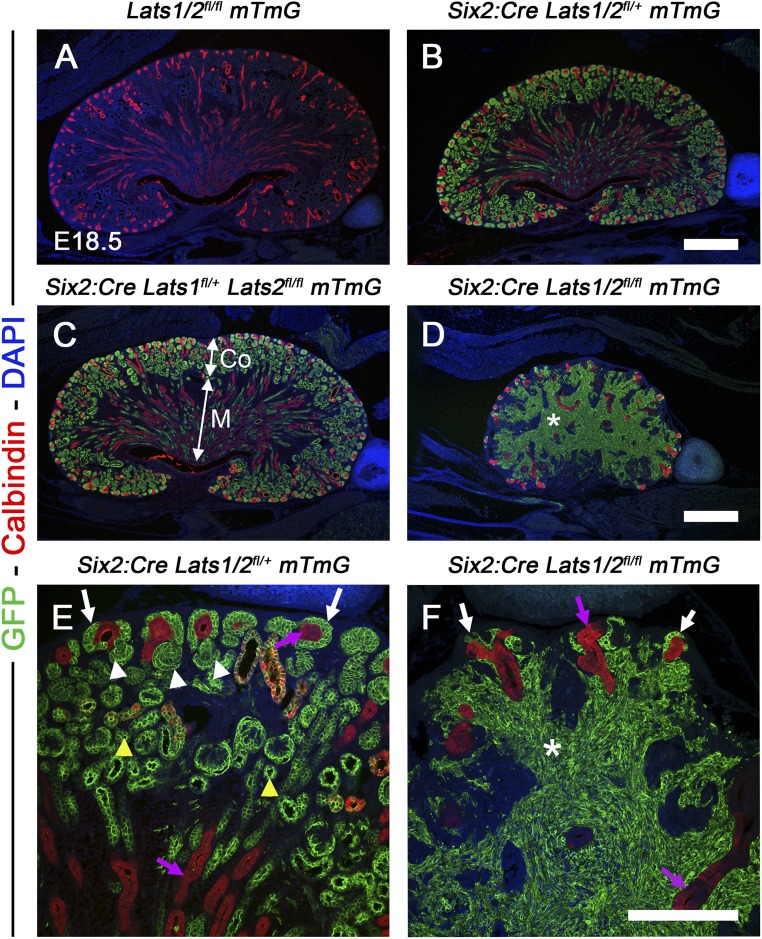
Accumulation of NP-derived cells in the Lats1/2CM−/− kidney. (A–D) GFP and calbindin staining in (A) negative control; (B) Six2:Cre Lats1/2flox/+ mTmG; (C) Six2:Cre Lats1flox/+ Lats2flox/flox mTmG; and (D) Six2:Cre Lats1/2flox/flox mTmG E18.5 kidneys, where GFP staining labels the Six2 expressing NPCs and their progeny, and calbindin the UB-derived structures (purple arrows). Note that calbindin is also expressed in distal tubules. (E) High magnification views of the cortical zone of double heterozygous knockout showed GFP staining is observed in NPCs (arrows), early nephrons (white arrowheads) and differentiated tubules (yellow arrowheads). (F) In contrast, nephrogenesis does not occur in Lats1/2CM−/− kidneys, and all cells that accumulate in the interstitium are GFP-positive (*), indicating they were derived from NPCs. Note the reduced pool of NPCs in Lats1/2CM−/− kidneys (white arrows). Co, cortex; M, medulla. Scale bars represent 500 µm (A–D) and 200 µm (E and F).

