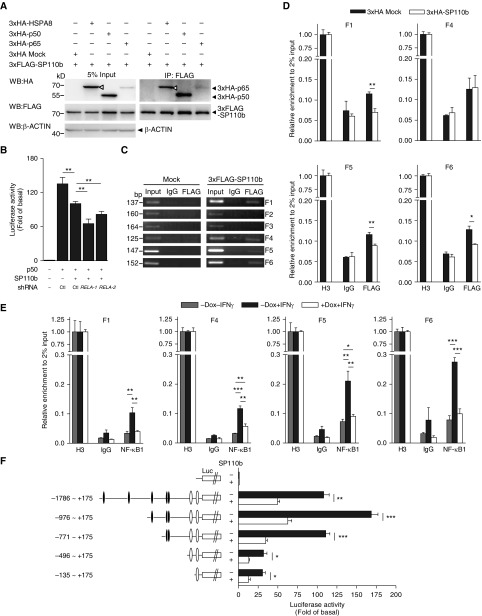
Figure 5.
SP110b interacts with nuclear factor-κB (NF-κB) binding sites in the tumor necrosis factor-α (TNF-α) promoter region. (A) Whole-cell HEK293T extracts were subjected to immunoprecipitation (IP) using an anti-FLAG antibody and analyzed by Western blotting (WB) with the indicated antibodies at 2 days post-transfection with the respective constructs. Open triangles indicate 3×hemagglutinin–heat shock 70 kDa protein 8 (3×HA-HSPA8). HSPA8 was used as a positive control (see the Methods section in the online supplement). (B) Relative luciferase (Luc, L.) values of the TNF-α promoter were measured 2 days after transient cotransfection of the HEK293T cells with the pGL3-TNF-α promoter-F.Luc, pSV40-R.Luc, and the indicated constructs. An empty vector control is shown in the left column. Ctl indicates a vector that expressed shLacZ (used as a control). (C and D) Nuclear extracts from HEK293T cells at 2 days post-transfection (C) with the empty vector (mock) or the 3×FLAG-SP110b–expressing vector or (D) with the 3×FLAG-p50–expressing vector plus an empty vector or plus the 3×HA-SP110b–expressing vector were subjected to chromatin IP using anti-FLAG, anti–histone H3 (H3), or anti-IgG antibodies, respectively. Precipitated DNA fragments were amplified by (C) polymerase chain reaction (PCR) and (D) quantitative PCR with the primer pairs indicated in Figure E5C. (E) Nuclear extracts from THP1-eGFP-SP110b clonal cell lines at 2 days post-treatment were subjected to chromatin IP using anti-NF-κB1, anti–histone H3 (H3) or anti-IgG antibodies, respectively. Precipitated DNA fragments were amplified by quantitative PCR with the primer pairs indicated in Figure E5C. (F) The relative Luc values of the full-length and serial deletion TNF-α promoter constructs were measured 2 days after transient cotransfection of HEK293T cells with pGL3-TNF-α promoter-F.Luc, pSV40-R.Luc, and the indicated constructs. An empty vector control is included in the top row. Solid ovals indicate putative NF-κB binding sites, and open ovals indicate NF-κB binding sites, as described in Figure E5C. (B, D, E, and F) Data are presented as the mean ± SD of three cultures. Statistical significance was calculated using a two-tailed, unpaired t test. *P < 0.05; **P < 0.01; ***P < 0.001. All data are representative of at least two independent experiments. Dox = doxycycline; eGFP = enhanced green fluorescent protein; RELA = the gene that encodes NF-κB p65 subunit; shRNA = short hairpin RNA.

