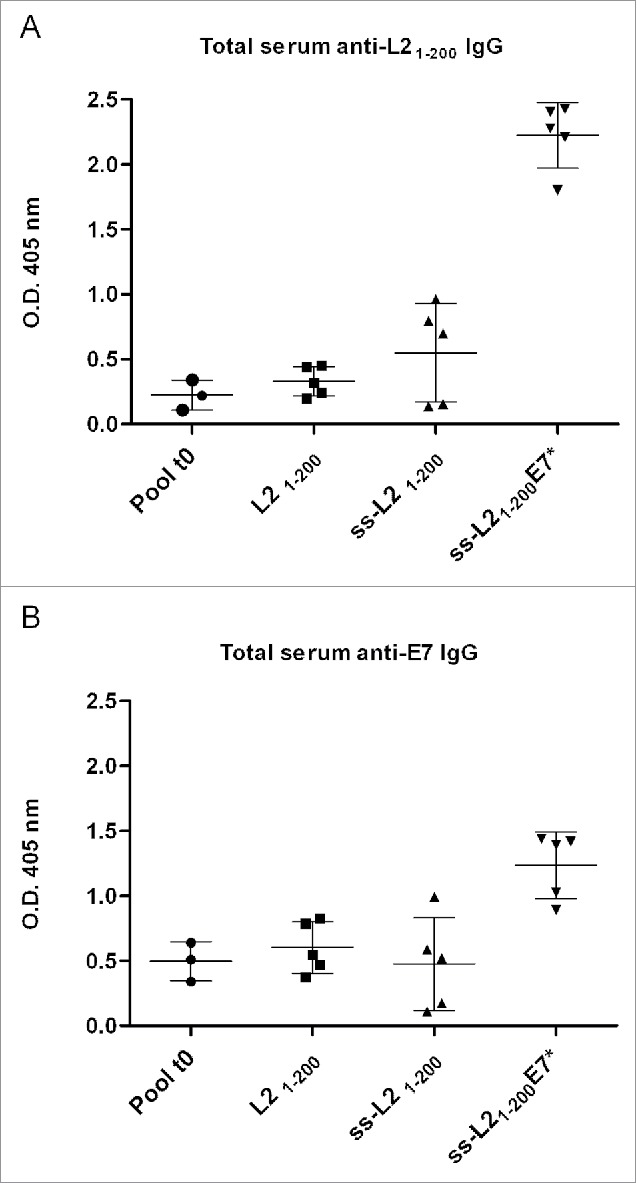
Figure 10.

Humoral immunological response to L21–200 and E7* in mice after vaccination with the L21–200, ss-L21–200 and ss-L21–200-E7*. C57BL/6 mice were immunized as described in Fig. 5D. Data for ELISA test were generated for sera collected from every mouse (m 1-5: mouse 1-5) of each vaccination group after coating with either His6-L21–200 (Fig. 10A) or His6-E7 (Fig. 10B) and are reported from one representative experiment. Humoral specific serum IgG responses are presented as optical density values at 405 nm of 1:100 diluted sera. The mean titer value from each group is marked with a dash. Pool t0: average of pool of pre immune sera for each treatments. Means and variances are significantly different (p < 0,05) according to the One-way ANOVA test and to the Bonferroni's multiple comparison test.
