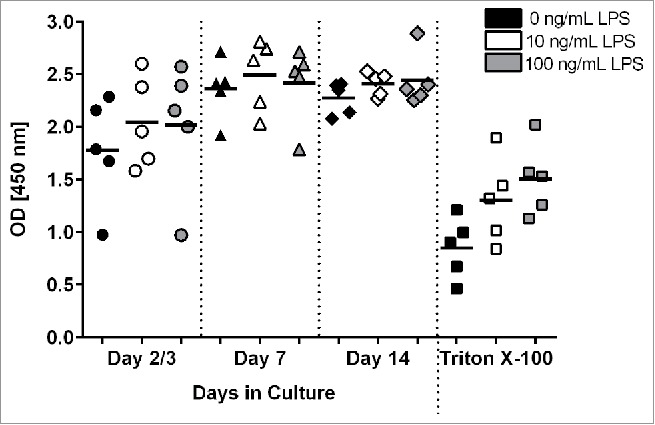
Figure 2.

Measurement of metabolic activity and viability in LPS- and Triton X-100 -treated PCLS. On days 2 or 3, 7, and 12 or 13 of cultivation, PCLS were treated with different concentrations of LPS or medium only for 18 hours. As a control, PCLS were treated with 0.25 - 0.3 mM Triton X-100 for 1 hour. Metabolic activity was measured by a WST-1 assay. Each symbol on the graph represents PCLS from a given donor with the lines representing the mean value for the PCLS treated with each condition.
