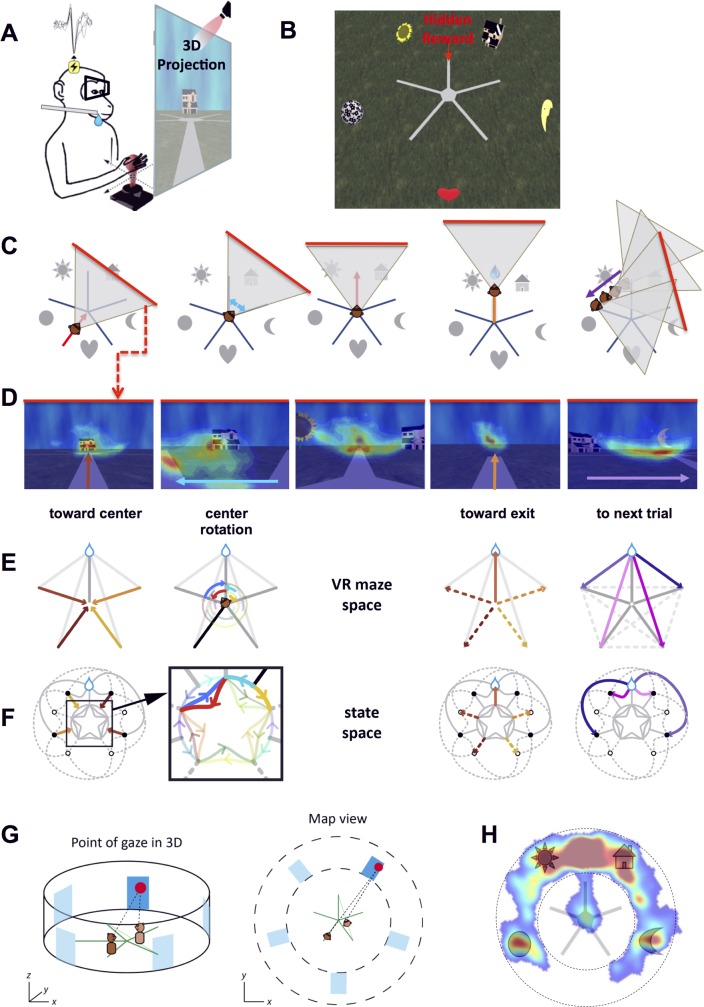
Fig 1. Experimental setup and behavioral task.
A. Experimental setup. The animal was seated in front of a 152 x 114 cm screen on which a computer-generated scene was projected in stereo. The animal was equipped with shutter glasses synchronized with the projection and could move in the virtual world via a joystick. A juice dispenser delivered reward directly in the animal’s mouth when the monkey reached a hidden rewarded area. B. View from above of the star maze. Five landmarks were placed between the five arms of the maze at a radius twice the arms’ length. A reward was given to the animal when he reached the end of an arbitrarily chosen arm (in this case, the arm between the sunflower and the house). C. A sequential illustration of the animal’s position and field of view at key representative events of a trial. (1) The animal starts at one end of a path and moves towards the center, (2) turns left or right in the center, (3) chooses one path, (4) enters the chosen path and is rewarded at the end if correct, and (5) the animal is relocated (joystick disengaged) to the next start. D. First-person view of the five events described in C, with a heat map of the monkey’s gaze fixations overlaid on the scene illustrating the animal’s scanning interests. Arrows indicate the main direction of motion of the animal. E. Illustration of the steps described in C and D in the actual maze space. Monkey’s moves are represented by colored arrows. F. Illustration of the state space in which neuronal data was analyzed. The same steps as in E are plotted in the state-space graph with corresponding colors. For convenience, the animal’s current position in the graph also denotes the animal’s current straight ahead direction. For example, a position in the northeastern part of the graph corresponds to the animal viewing the northeast from its physical position. The state-space representation parses the animal’s trajectories into a series of action- or position-triggered transitions between choice points (graph vertices). Starting positions are figured as black dots. All actions that can eventually lead to the reward are in solid lines, while dashed lines indicate either erroneous actions leading to the end of unrewarded arms (open circles) or the path to the next start, outside the maze arms. This representation allows describing in a similar way the moves that include a translation and the purely rotational moves made in the center of the maze (expanded inset in the black square). Rotations of 72° (angle between two maze arms) are mapped to the central part of the graph, with counterclockwise rotations innermost (e.g., in red). Rotations of 36° (angle between landmark and maze arm) are mapped to the outer circular arcs (either clockwise or counterclockwise; e.g., in cyan). G. Mapping the animal’s 3-D point of regard. Left: three-dimensional schematic of the maze (green), monkey (brown), and point of gaze (red dot). Blue rectangles represent the location of the landmarks. For ease of representation, we define an invisible cylindrical wall running through the landmark centroids. Right: convention for the flattened representation of the point-of-gaze map. When directed further than the distance to the landmark wall, the point of gaze was computed as directed towards this wall; then, in a second step, this wall was flattened as an annulus to create the final 2-D map. H. Heat map of the point of gaze, overlaid on a schematic of the maze for one session (monkey S). The regions of interest explored by the animal are the ends of the paths, the landmarks, and the rewarded area.

