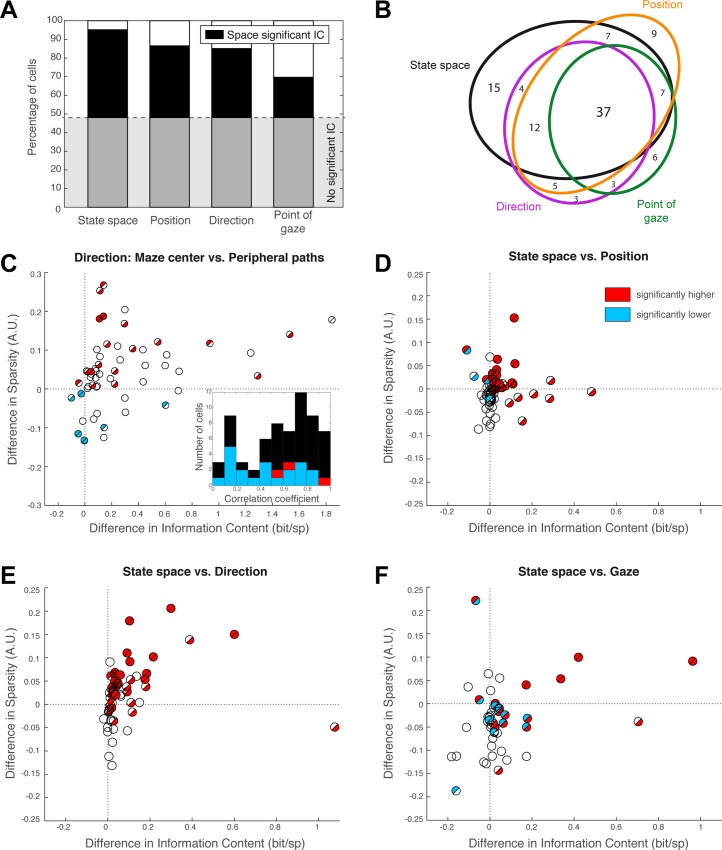
Fig 3. Population statistics.
A. Proportion of responsive cells (cells with significant information content [IC], above gray line) and proportion of cells significantly coding each of the four spaces (black). Open bars correspond to cells with significant IC in another space. B. Representation of the main intersections amongst each subpopulation of cells represented in A. Most responsive cells carry significant activity in more than one coding space. C. Analysis of the responsive cells’ directional sensitivity and selectivity, comparing activity in the center of the maze to activity on peripheral paths to next start. The difference in information per spike is plotted against the difference in sparsity. Filled half-discs indicate significant differences, as established per cell (top-left half: significant sparsity difference; bottom-right half: significant information difference). Red indicates significantly positive differences (i.e., center > periphery), and blue indicates negative differences (center < periphery). Overall, the activity in the center is both more consistent and more direction specific. Inset: Distribution of the correlations between directional tuning in the center and in the periphery. Significantly high (red) and low (blue) correlations are indicated. D–F. Difference in information per spike versus difference in sparsity when comparing cell activity readout in state space to activity readout in position space (D), direction (E), and point of gaze (F). Same graphical conventions as in C. Statistical significance was obtained with permutation tests (surrogate spike datasets). Underlying data can be found at http://dx.doi.org/10.6080/K0R49NQV.

