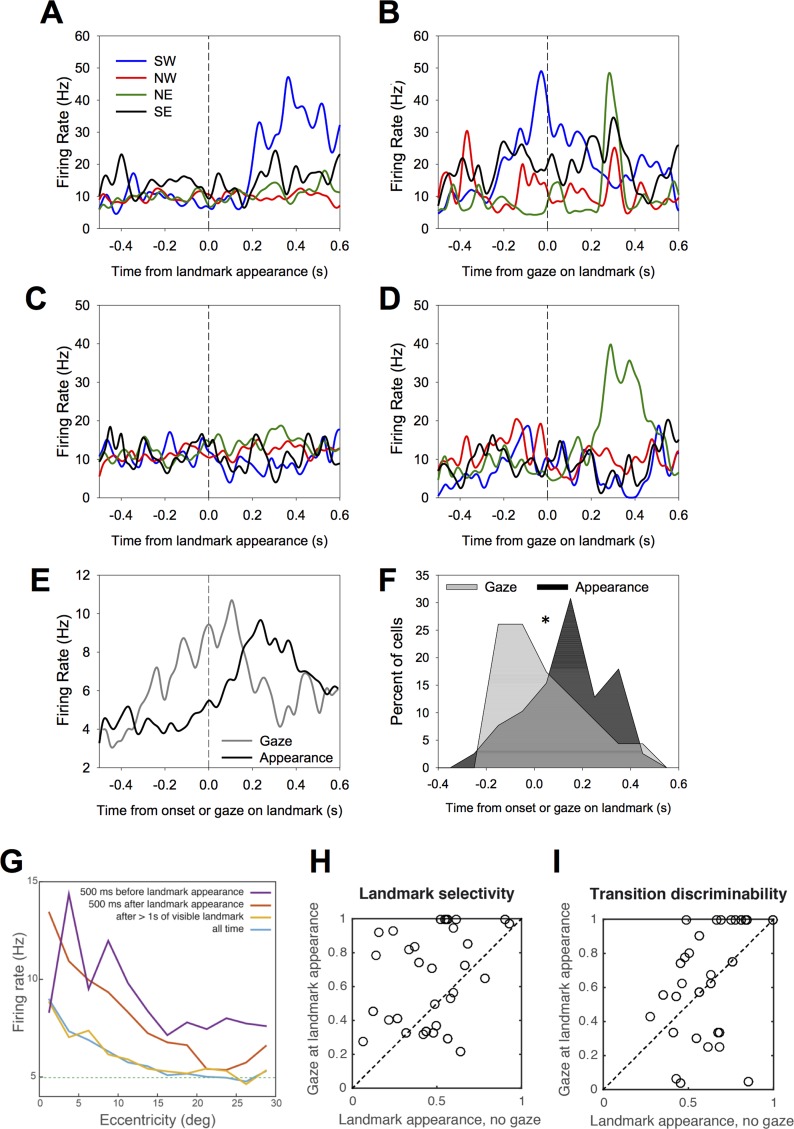
Fig 7. Modulation of cell selectivity by the point of gaze.
A. Mean activity of an example cell towards each of the four landmarks aligned on the entry of the landmark in the field of view or B aligned on the animal’s saccade towards the landmark. This cell has a preference for the southwestern landmark, and its activity peaks at the time of the saccade on the landmark. C–D. A second example cell with the same conventions as in A–B. This cell shows a higher activity to the southeastern landmark when the animal gazes at it (D) compared to when it enters the visual field (C). Those two examples illustrate two patterns of activity: (1) the activity of the cells peaks around the moment that the eyes reach the landmark, and (2) the gaze increases the firing rates associated with one landmark. E. The temporal dynamics of the mean cell activity with respect to landmark appearance or gaze on the landmark. F. Distribution of the latencies with respect to landmark appearance or foveation. G. Mean cell activity as a function of landmark eccentricity on the retina, considering four set of epochs relative to landmark appearance (see main text). Firing was always modulated by foveation but more so when the landmark recently appeared (red). Cells fired in anticipation of the landmark (purple), but activity was higher if the monkey had previously made a saccade close to its expected point of appearance. Dashed line: average firing rate. Note that the vertical scale does not begin at zero. H. Landmark selectivity indices calculated for activity aligned on landmark appearance when gaze was not directed to them versus activity aligned on landmark foveation following its appearance. I. Same as H for the path selectivity index. Underlying data can be found at http://dx.doi.org/10.6080/K0R49NQV.

