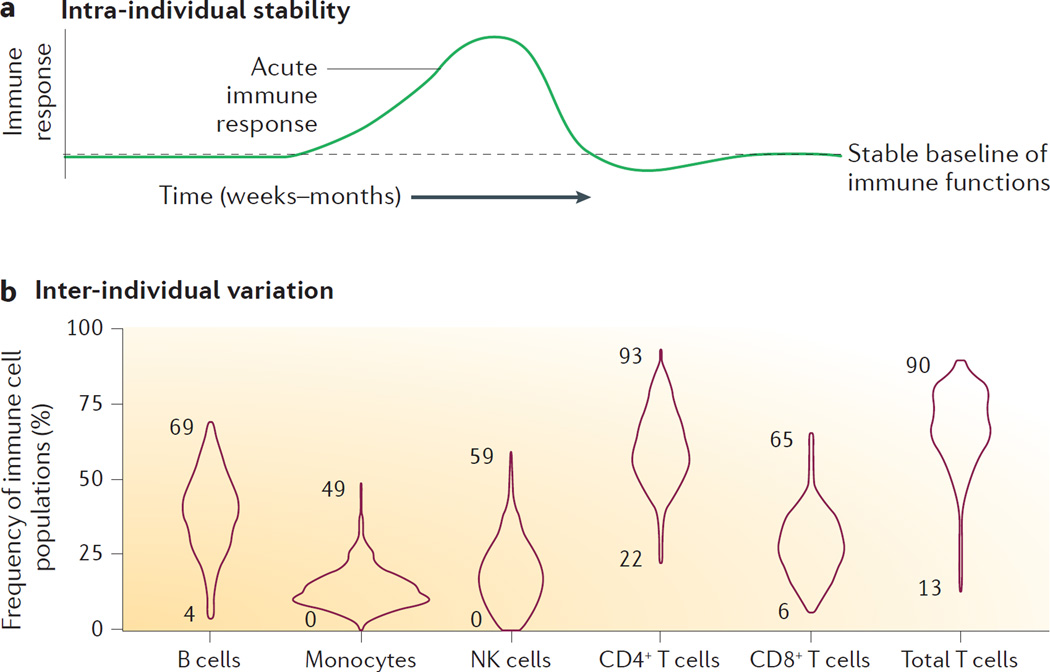
Figure 2. Variation in immune cells and proteins.
a | An illustration of the observed stability of most immune cell and protein measurements over the course of weeks to months. During acute immune responses drastic changes occur, but thereafter measurements seem to return to a stable baseline. b | Distributions of six principal immune cell populations from a Stanford cohort (n = 398) of healthy adults11,17. Numbers indicate minimum and maximal values observed.

