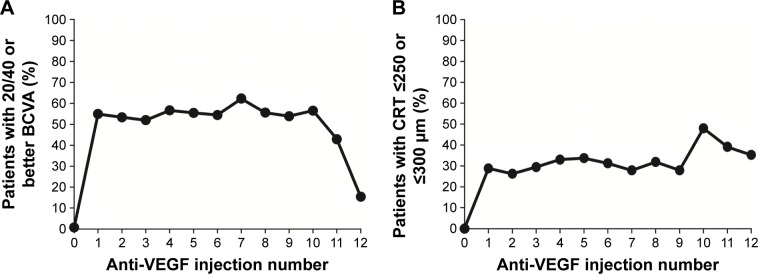
Figure 4.
Response rates after each anti-VEGF injection.
Notes: (A) Percentage of patients with 20/40 or better BCVA. The number of patients for injection numbers 0 through 12 was 130, 133, 135, 129, 113, 101, 79, 53, 45, 39, 23, 14, and 13, respectively. (B) Percentage of patients with CRT ≤250 μm on TD-OCT or ≤300 μm on SD-OCT. The number of patients for injection numbers 0 through 12 was 119, 118, 122, 129, 106, 83, 80, 61, 47, 43, 25, 23, and 17, respectively.
Abbreviations: BCVA, best-corrected visual acuity; CRT, central retinal thickness; SD-OCT, spectral-domain optical coherence tomography; TD-OCT, time-domain optical coherence tomography; VEGF, vascular endothelial growth factor.

