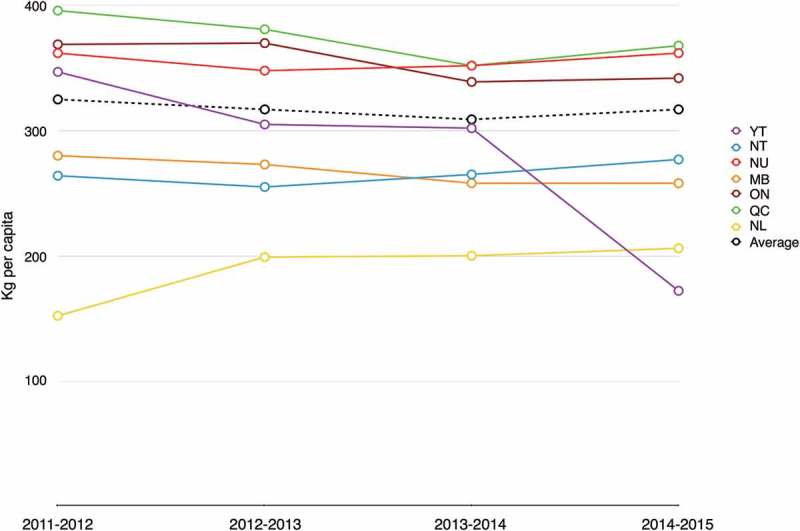
Figure 3.

Annual per capita subsidy shipments (kg)* for communities eligible for full subsidy** by province/territory. *Calculated from per capita shipments (kg) and 2011 population estimates23 **Data omitted for Quebec North Shore communities, which receive subsidy for limited periods annually; no shipments reported for Trout Lake NT over the period 2011–2015
