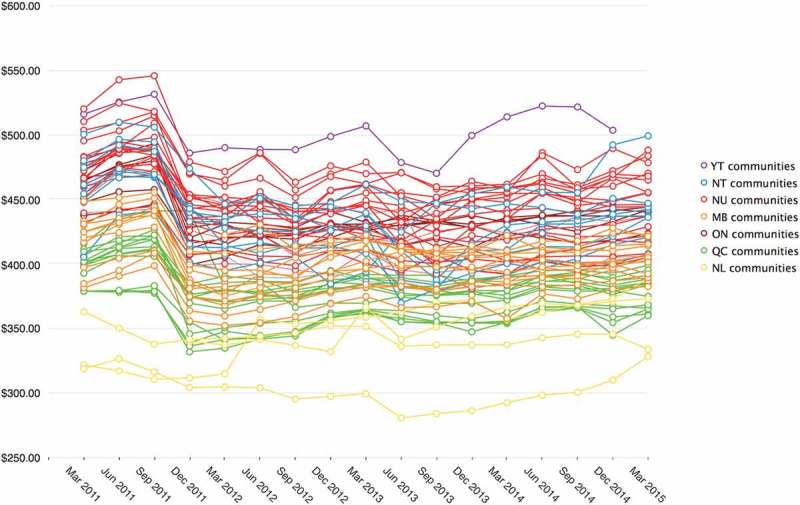
Figure 6.

Average RNFB cost* 2011–2015 for communities eligible for full subsidy** by community [27–30].
* RNFB costs are supplied by retailers.20 **Cost estimates are unavailable for 10 of the 69 eligible communities. Partial data are available for several of the remaining communities: No data are available for Pauingassi MB for June-December, 2011; No data are available for Rigolet NL for March 2011; No data are available for Old Crow, Yukon for March 2015. Data for Quebec North Shore communities are not included as they are served by NNC for short periods only when there is no marine service available.
