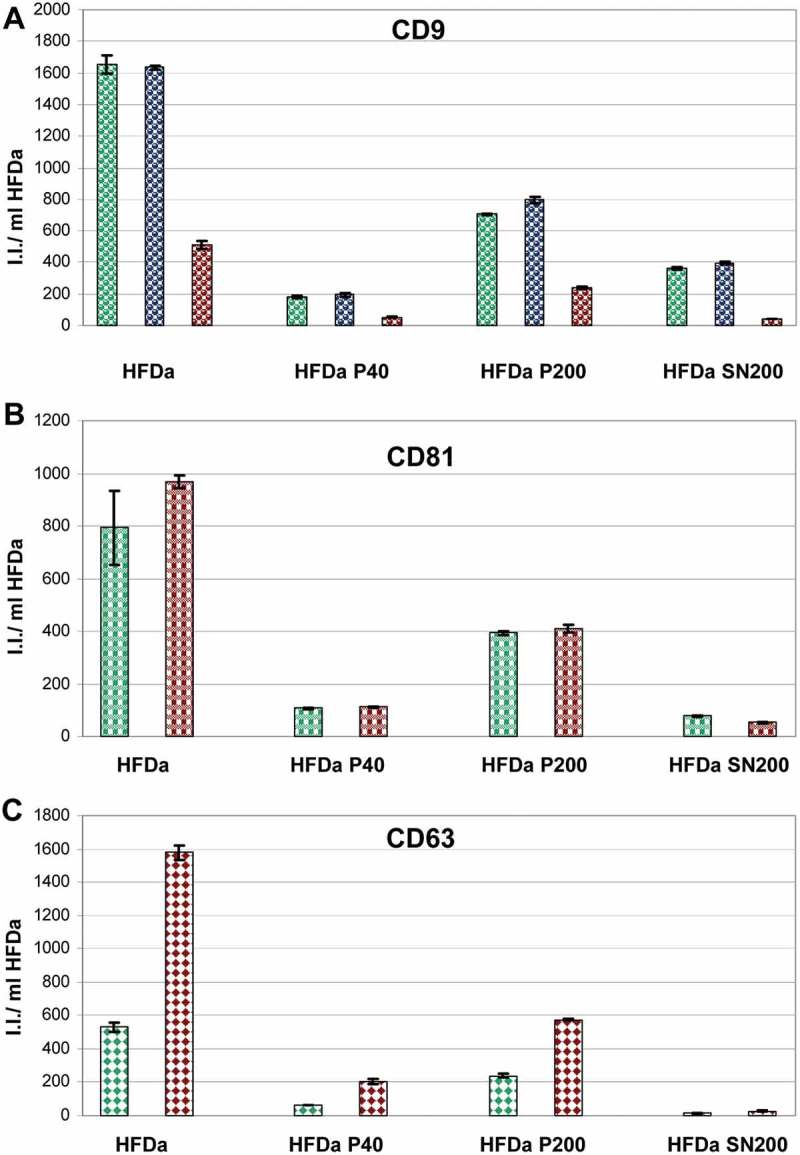
Figure 6.

Plots of the fluorescent integrated intensity (I.I.) per ml of HFDa ± standard deviation of vesicles-immobilised FLISA (Supplemental Figure S4) per each fraction obtained from the differential centrifugation protocol. (A) CD9 (green R&D Systems antibody, blue Merck Millipore antibody, red HansaBioMed antibody); (B) CD81; (green R&D Systems antibody, red HansaBioMed antibody); (C) CD63 (green R&D Systems antibody, red HansaBioMed antibody).
