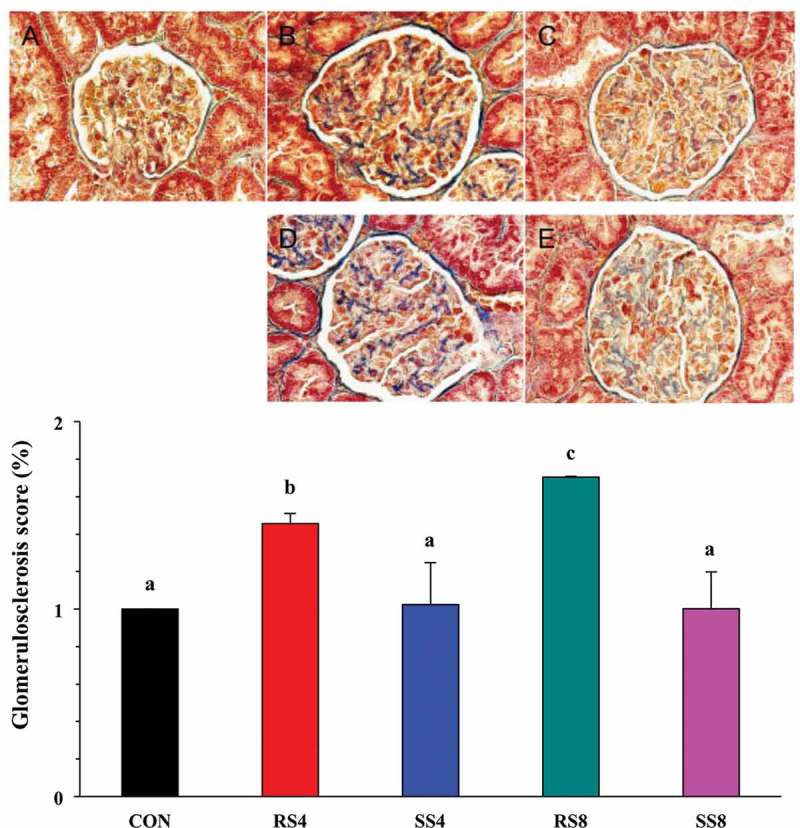
Figure 4.

Effect of high-salt diet on kidney histopathology as revealed by Masson’s trichrome staining in the glomerular capsule and tufts (400× magnification). (a): CON, no fibrosis. (b): RS4, moderate fibrosis (arrows). (c): RS8, severe fibrosis (arrows). (d): SS4, and (e): SS8, very mild fibrosis (arrows). Graph on the bottom shows quantitative representation of renal injury in the kidneys of Dahl salt sensitive rats fed the different diets for 15 weeks. Glomerulosclerosis index for each rat was used to estimate the renal damage. Values are presented as mean ± SEM. Labelled means without a common letter differ significantly at P < 0.05.
