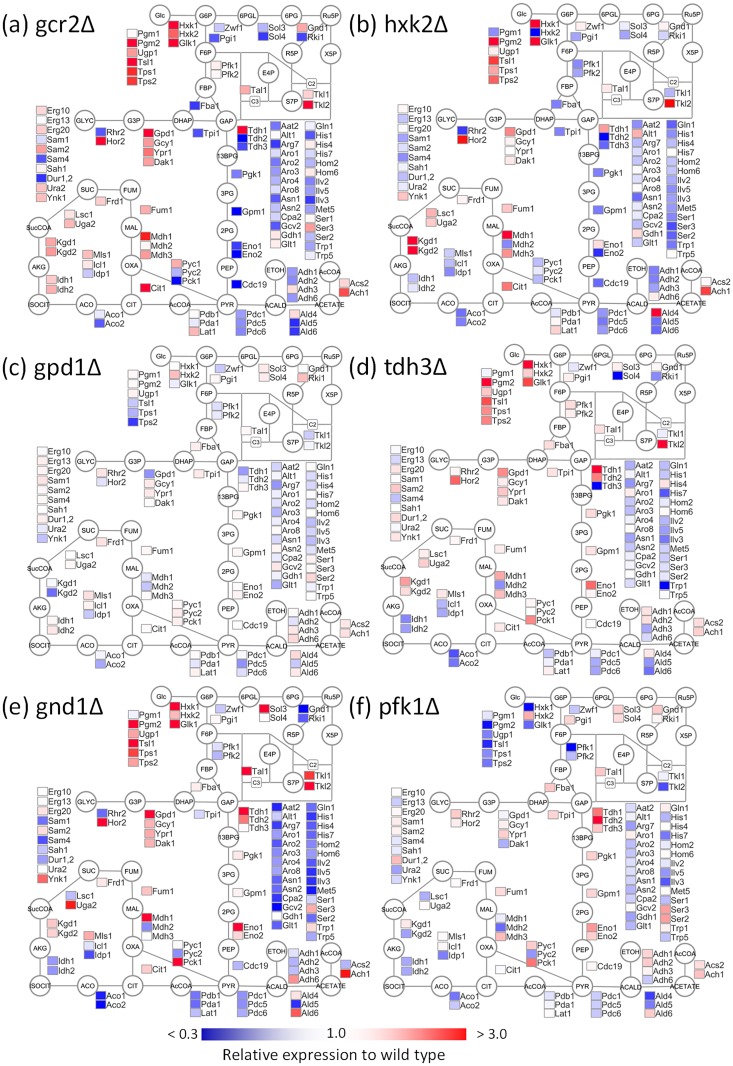
Fig 2. Protein abundance profiles of the central metabolism related enzymes in Saccharomyces cerevisiae.
The data obtained from (a) gcr2Δ, (b) hxk2Δ, (c) gpd1Δ, (d) tdh3Δ, (e) gnd1Δ, and (f) pfk1Δ strains lacking GCR2, HXK2, GPD1, TDH3, GND1, and PFK1 genes were represented, respectively. Enzyme abundance levels relative to that of wild type (BY4742) were shown as a heat map of simplified metabolite pathways. All abbreviations were described in the legend for Fig 1.

