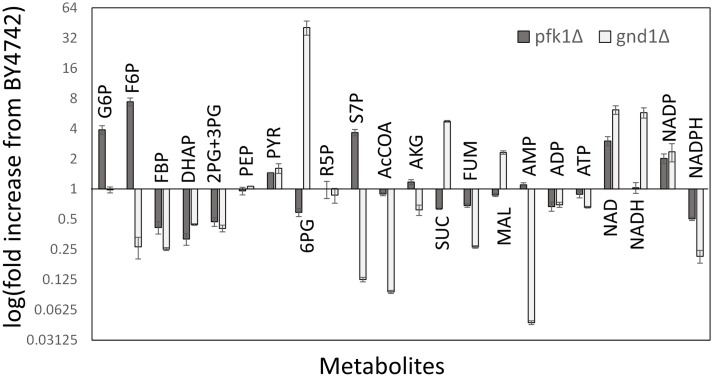
Fig 4. Metabolite profiles in pfk1Δ and gnd1Δ strains.
Fold increase with respect to the BY4742 strain is shown for each metabolite. Data are shown as the means of triplicate analyses with standard deviations. All abbreviations were described in the legend for Fig 1.

