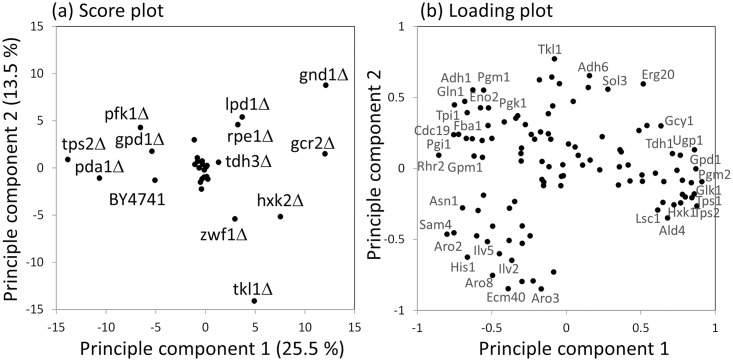
Fig 6. Principle Component Analysis (PCA) of the enzyme abundance data.
(a) PCA score plot for mutants. The mean, log2-transformed and z-scored enzyme abundance data was used for the analysis. The score plots of principle component 1 and 2 are shown in the figure. (b) Loading plot of principle component 1 and 2. Strain and enzyme names were represented in the Figures.

