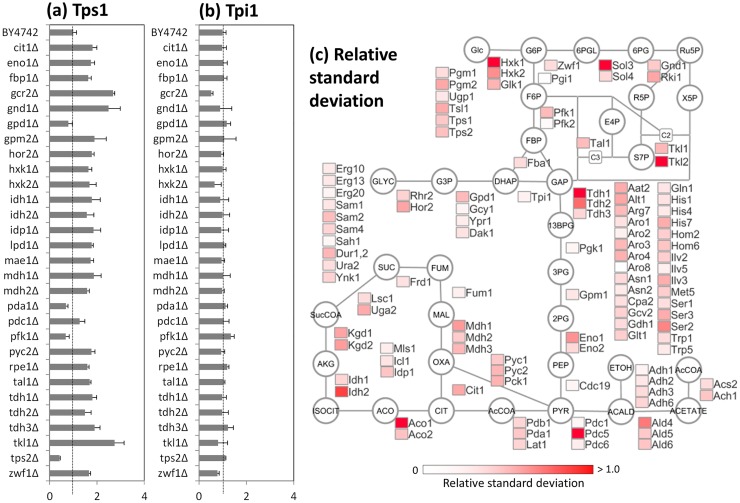
Fig 8. Variation of enzyme abundances among S. cerevisiae mutants.
(a and b) Abundances of (a) Tps1 and (b) Tpi1 proteins in single gene deletion mutants. Lines indicate abundances of wild type (BY4742). Data are shown as the mean of triplicate analysis with standard deviations. (c) Relative standard deviations of enzyme expression levels among 30 wild type strain and mutants. The data were represented as a heat map in the simplified metabolic pathways.

