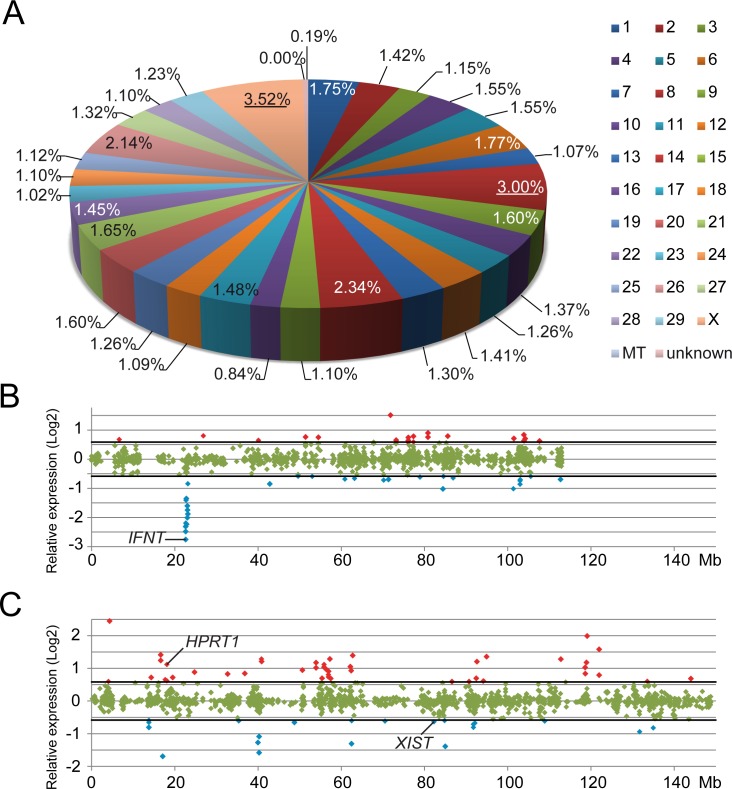
Fig 4. Chromosome distribution.
Proportional distribution of differentially expressed probes per chromosome, mitochondrion (MT) or of unknown location (A). Chromosome 8 (red; 3.00%) and the X chromosome (pink; 3.52%) were overrepresented (as indicated with the underlined percentages) by differentially expressed probes. The relative expression (Log2) of probes with higher (cut off 1.5-fold change indicated with thick black lines) expression levels in NHSM (red) or in SOF (blue) developed ICMs are plotted with respect to the location on chromosome 8 (B) and the X-chromosome (C).

