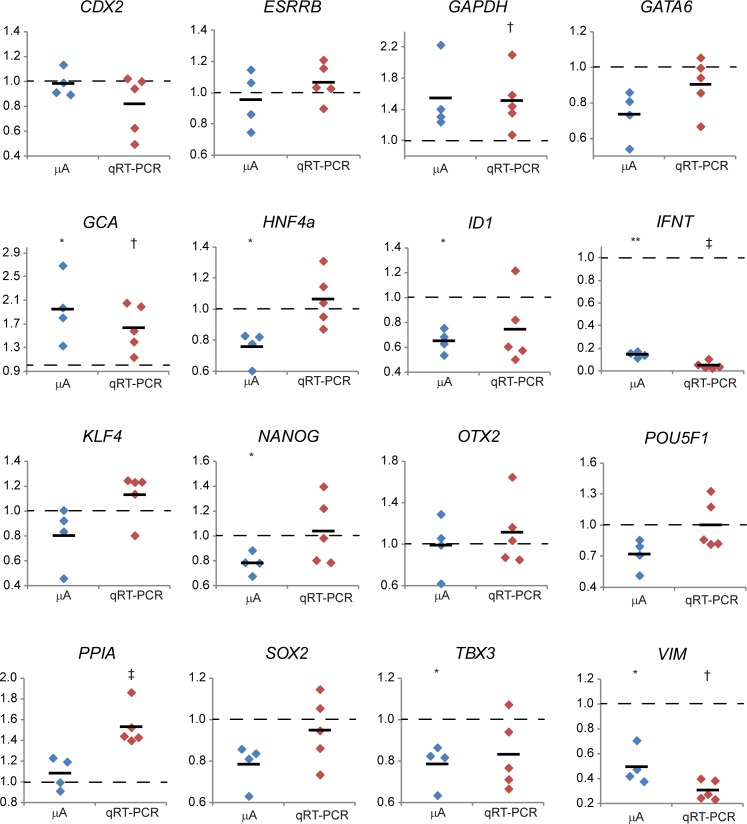
Fig 5. Relative gene expression levels in ICMs from day 9pf embryos.
The expression of selected genes in SOF-cultured ICMs is set at 1 (dashed line) to show the relative gene expression (y-axis) in NHSM-cultured ICMs after microarray analysis (mA; blue) and qRT-PCR (red). Levels of significantly different expression (p<0.05 or p<0.01, respectively) are indicated by single or double asterisks or single or double dagger in microarray or qRT-PCR, respectively.

