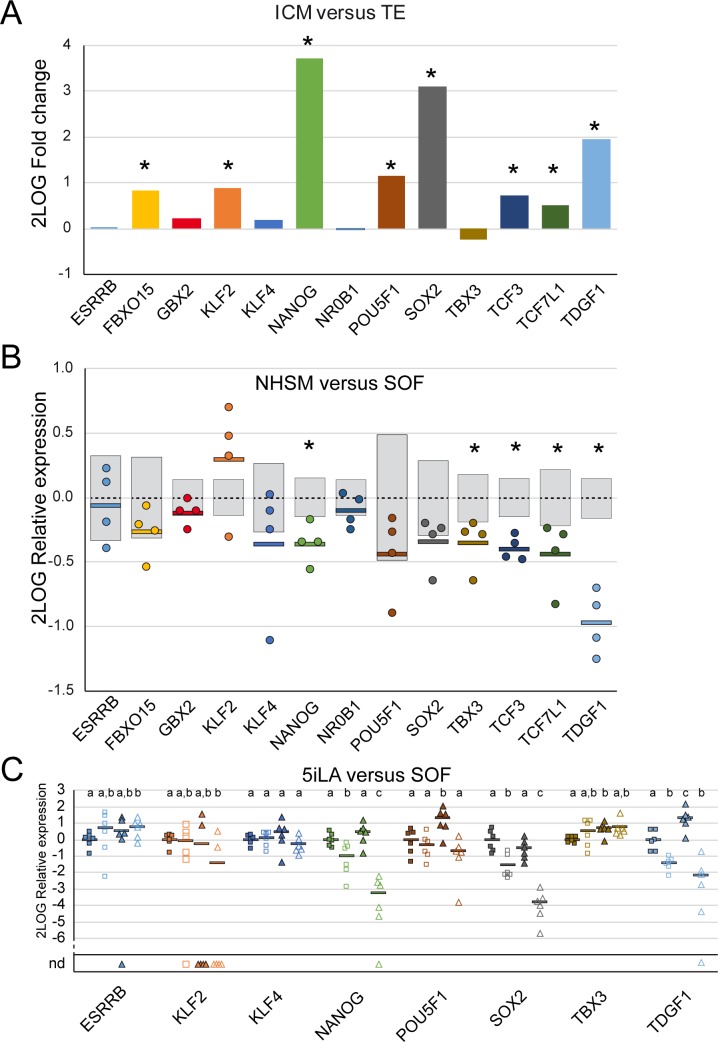
Fig 6. Expression differences of pluripotency related genes in the ICM and TE.
Microarray data (GEO accession no. GSE63054; [14]) were analyzed for the differential expression of a selection of pluripotency related genes comparing dissected ICM and TE from bovine day 9pf embryos cultured in SOF (A). 2Log TE expression was set at 0 and significant differences indicated by an asterisk (*). The same genes were assessed in the microarray performed for this study (B). 2Log average ICM expression levels (dashed lines) from SOF-cultured embryos was set at 0 with grey bars indicating SD. Relative 2Log expression levels in ICMs from NHSM-cultured embryos are depicted by dots and averages indicated by a horizontal bar. Significant average expression differences are indicated by an asterisk (*). Quantitative RT-PCR was performed to determine expression of 8 selected genes in the ICM (closed symbols) and TE (open symbols) of 5iLA- (squares) and SOF-cultured (triangles) day 9pf embryos (each 6 groups of 10 ICMs or TEs). 2Log average expression in the 5iLA-cultured ICM was set at 0 per gene. ICM or TE samples without detectable gene expression are indicated as nd. 2Log average gene expression is indicated by a horizontal bar and significant differences indicated by different letters.

