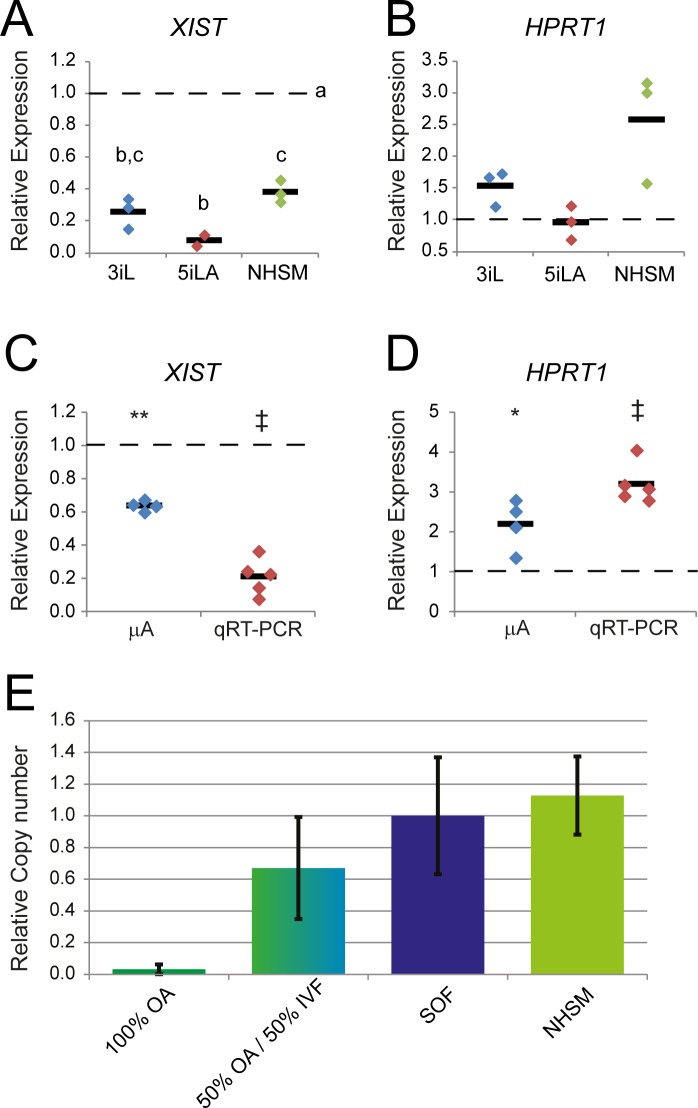
Fig 7. XCI in bovine embryos.
Relative expression levels of XIST (A) and HPRT1 (B) were determined by qRT-PCR in day 8pf embryos cultured in 3iL (blue), 5iLA (red) and NHSM (green) and compared with SOF day 8pf embryonic expression levels set at 1 (dashed line). Relative expression levels of XIST (C) and HPRT1 (D) in ICMs dissected from day 9pf embryos cultured in NHSM were obtained by microarray (mA; blue) and qRT-PCR (red) and compared with their SOF counterparts set at 1 (dashed line). Relative copy numbers (mean ± SD) of genomic SRY (E) was determined in parthenogenetically activated oocytes (OA), a combination of OA and IVF produced blastocysts cultured in SOF (green/blue), IVF SOF-cultured blastocysts alone (purple; set at 1), and cultured in NHSM (green) by PCR.

