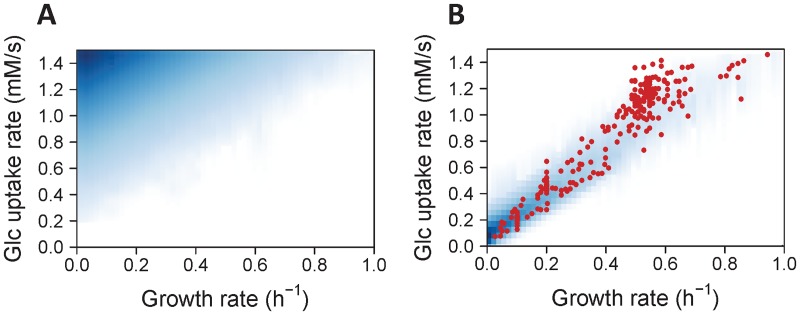
Fig 4. Exploration of the solution space of E. coli metabolism with and without metabolic regulation.
Density of scatter plots between glucose uptake and growth rates sampled using the stoichiometric model (A, without metabolic regulation) or the kinetic model (B, with metabolic regulation). Shades of white to blue denote null to high frequency, respectively. Red dots are measurements obtained from 254 independent cultivations of wild-type and mutant E. coli strains on glucose, carried out under a wide range of cultivation conditions.

