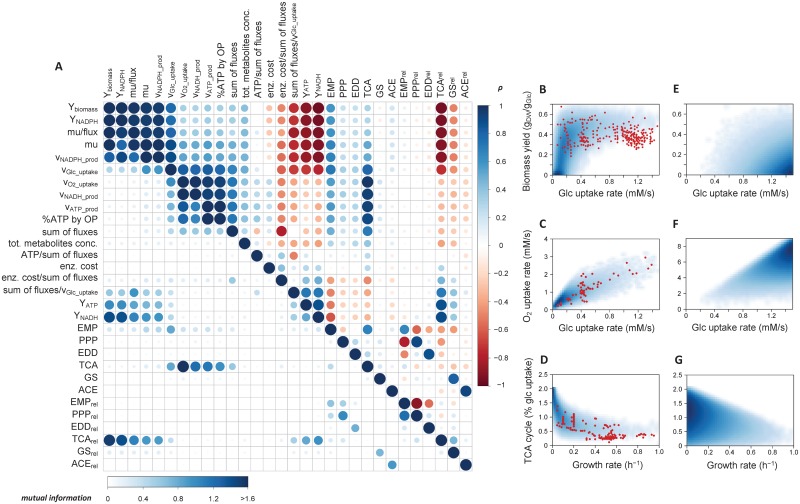
Fig 5. Identification of the functional couplings that are independent of enzyme levels.
Steady-states were simulated for 600,000 sets of random enzyme levels, and the relationships between various systemic variables, absolute fluxes, and relative fluxes through the different pathways were identified using Spearman correlation test (above diagonal) and mutual information (below diagonal). For Spearman correlation test, red and blue colors represent negative and positive correlations, respectively, and color intensity and circle size indicates high (darker, larger) to low (lighter, smaller) correlation coefficient. For mutual information, color and circle size denote low (white, smaller) to high (blue, larger) mutual information, respectively. The density of scatter plots between particular steady-state variables (glucose and oxygen uptake, growth rate, biomass yield, and relative fluxes through the TCA cycle) sampled using the kinetic model (B-D, with metabolic regulation) or the stoichiometric model (E-G, without metabolic regulation). Shades of white to blue denote null to high frequency, respectively. Red dots are measurements obtained from a total of 266 independent cultivations (254, 65 and 192 in panels B, C and D, respectively) of wild-type and mutant E. coli strains on glucose, carried out under a wide range of cultivation conditions.

