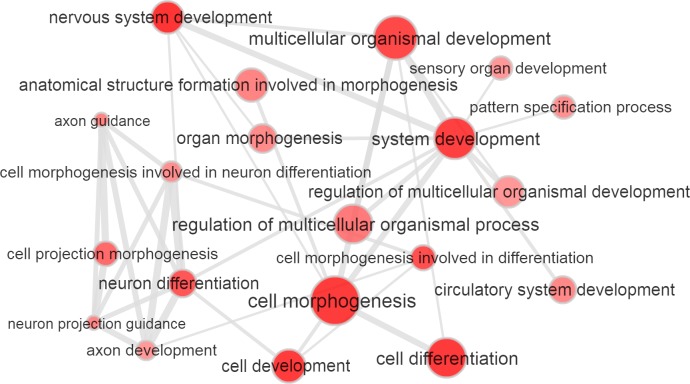
Fig 3. Similarity network based on GO enrichment results.
Bubble color indicates the GO p-value; bubble size indicates the frequency of the GO term in the Gene Ontology Annotation (UniProt-GOA) Database which annotates all UniProt entries with GO terms. Highly similar GO terms are linked by edges in the graph, where the line width indicates the degree of similarity.

