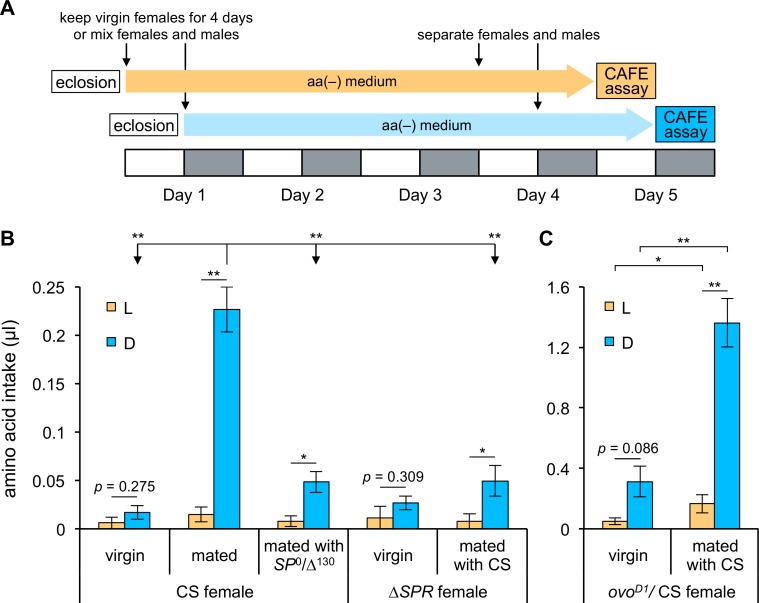
Fig 4. A post-mating signal elevates amino acid consumption during the dark phase.
(A) The experimental scheme for the CAFE assays. Each L phase is shown by a white box and each D phase by a gray box. (B and C) Amino acid consumption during L (orange bars) and D (blue bars) phases was quantified using no-choice CAFE assays with the following strains: virgin CS females and CS females mated with CS or SP0/Δ130 males (B; n = 3 or 4 trials); virgin Df(1)Exel6234 (shown as ΔSPR) females and Df(1)Exel6234 females mated with CS males (B; n = 4 trials); and virgin ovoD1/CS females and ovoD1/CS females mated with CS males (C; n = 4 trials). Intake per single fly is shown. Error bars indicate SEM. *p < 0.05 and **p < 0.01 for comparisons between L and D phases for each type of female in (B) and (C) using the Student’s t-test. p > 0.05 for all comparisons during L phase among females in (B) using one-way ANOVA. *p < 0.05 and **p < 0.01 for all comparisons during D phase among females in (B) using one-way ANOVA followed by post hoc Bonferroni/Dunn test. *p < 0.05 and **p < 0.01 for comparisons between ovoD1/CS virgin and mated females in (C) using the Student’s t-test.

