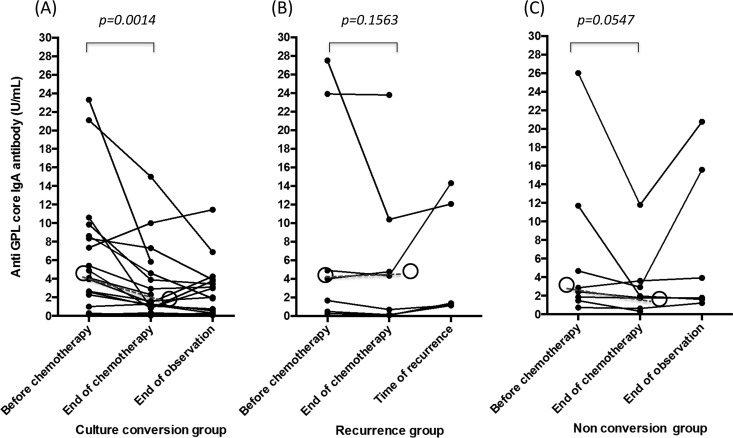
FIG 3.
Levels of individual patient serum IgA antibody against glycopeptidolipid core antigen before chemotherapy, at the end of chemotherapy, and at the end of observation or time of recurrence. Data are expressed as individual data (●) and shown separately for the three groups based on the outcome of therapy. (A) Culture conversion group; (B) recurrence group; (C) nonconversion group. In the recurrence group, the data are lacking at the time of recurrence in two patients because their recurrence occurred during the chemotherapy. Open circles represent the median values, and dashed lines represent the change in median values for the group. P values were calculated based on the median antibody levels before and after chemotherapy using the Wilcoxon matched-pair signed-rank test.

