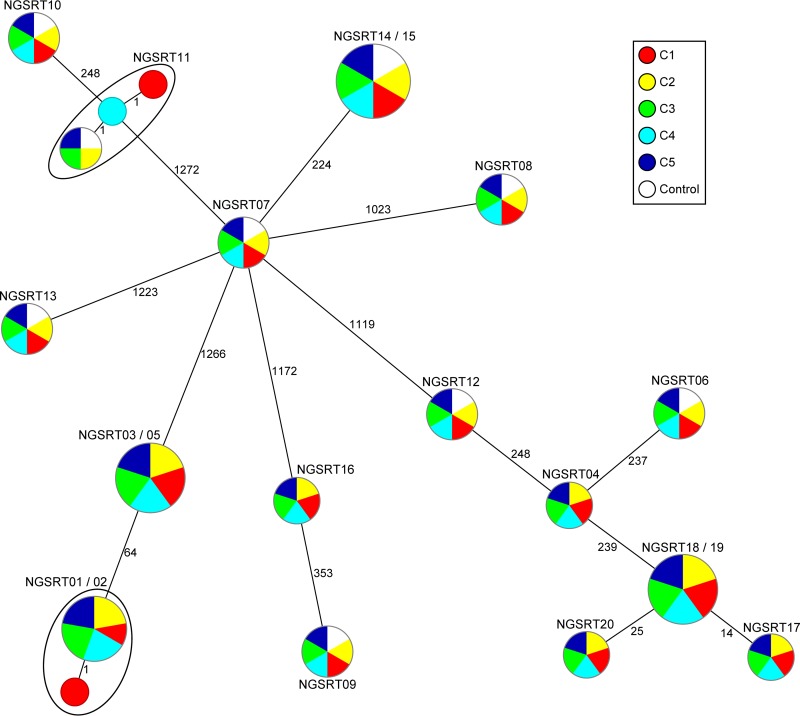
FIG 1.
Minimum-spanning tree illustrating the comparison of cgMLST results from the 20 S. aureus isolates sent to five laboratories (C1 to C5) in a blinded fashion. Each circle represents a single genotype, i.e., an allelic profile based on up to 1,861 target genes (23) present in the isolates with the “pairwise ignoring missing values” option turned on in the SeqSphere+ software during comparison. The circles are named with the sample ID(s) colored by the participating laboratory, and the sizes are proportional to the number of isolates with an identical genotype. The numbers on connecting lines display the number of differing alleles between the connected genotypes. The control samples colored in white originated from independent cultivations and DNA extractions of samples NGSRT06 to NGSRT15.

