FIG 1.
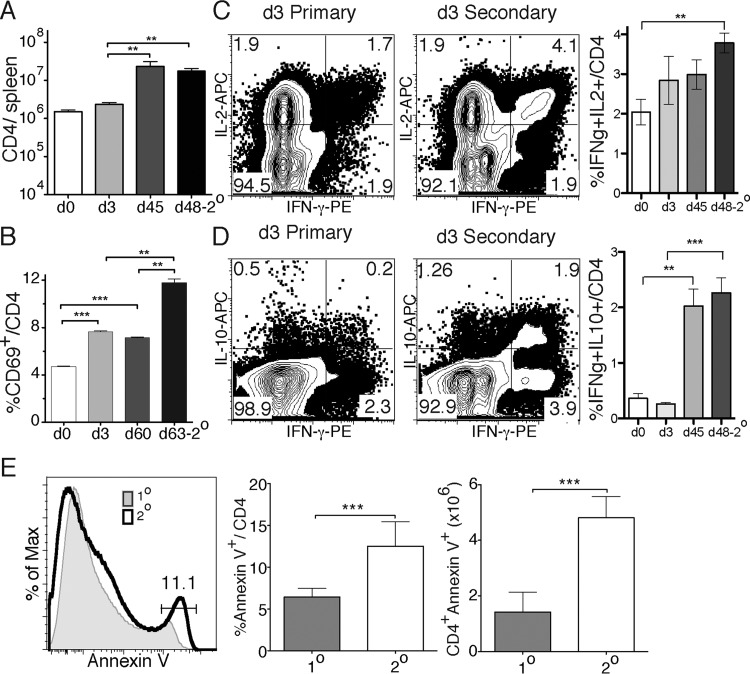
More polyclonal CD4 T cells are activated quickly after a second infection than after the first infection. Endogenous CD4 T cells from the spleens of P. chabaudi-infected age-matched BALB/c mice were analyzed after primary or secondary infection. (A) Total CD4 T cell numbers recovered on day 0, 3, or 45 after primary infection or day 48, 3 days after a second infection (d48-2°). (B) Percentages of CD69+ CD4 T cells on day 0, 3, or 60 of a primary infection or day 63, 3 days after a second infection (d63-2°). (C and D) Contour plots and summary graphs showing cytokine profiles of IFN-γ and either IL-2 (C) or IL-10 (D) by intracellular cytokine staining of CD4+ T cells from day 3 after primary or day 3 after secondary infection (day 48). (E) Histogram and summary graphs showing annexin V staining of CD4 T cells at day 5 p.i. of a first (1°) or second (2°) infection (day 50). The data represent three independent experiments with five mice per group, and error bars represent the standard errors of the mean (SEM). The plots are contour plots with outliers of a representative mouse from each group. **, P < 0.01; ***, P < 0.005 (Student t test).

