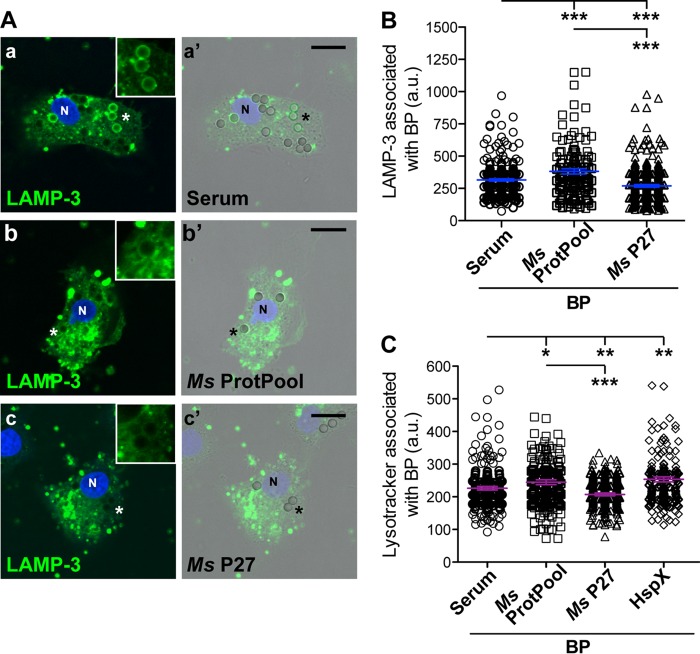
FIG 3.
P27 decreases the association of LAMP-3 with polystyrene bead-phagosomes (BPs). (A) BMDMs were incubated with 3-μm polystyrene beads coated with bovine serum proteins (serum images a and a′), a pool of M. smegmatis proteins (ProtPool images b and b′), or M. smegmatis P27 protein (P27 c and c′) for 1 h of uptake. Next, the cells were washed and incubated for 1 h of chase. Subsequently, the cells were fixed and stained with anti-LAMP-3 antibody, followed by Alexa Fluor 488-coupled anti-goat IgG (green), and then analyzed by confocal microscopy. Phase-contrast images show the beads. Nuclei were stained with DAPI (blue). Scale bars, 10 μm. Insets show the BPs labeled with asterisks in the cells. (B) Quantitative analysis of the LAMP-3 fluorescence intensity association to polystyrene bead-phagosomes (BPs) coated with the different proteins shown in panel A. (C) BMDMs were incubated with 3-μm polystyrene beads coated with bovine serum proteins (serum), a pool of M. smegmatis proteins (ProtPool), M. smegmatis P27 protein (P27), or HpsX protein for 1 h of uptake. Next, the cells were washed, followed by incubation for 1 h of chase with the addition of the dye LysoTracker Red (50 nM) to detect acidic compartments. The cells were fixed and analyzed by confocal microscopy. The fluorescence intensity association of LysoTracker to the BPs was quantified. Data represent the means ± the SEM of three independent experiments. In all panels, the asterisks indicate significance: *, P ≤ 0.05; **, P ≤ 0.01; and ***, P ≤ 0.001. The data were analyzed using a two-tailed Student t test.

