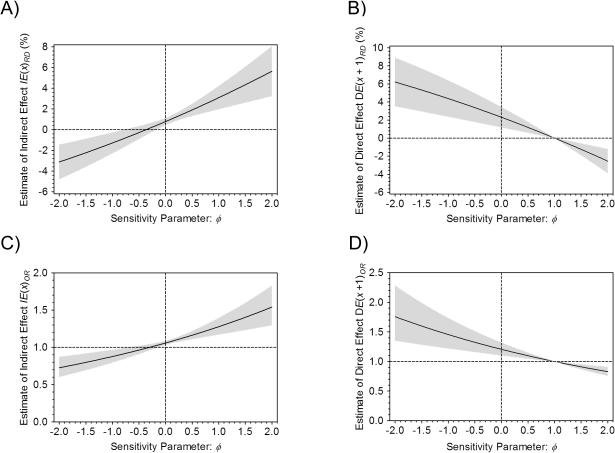
Figure 2.
Sensitivity analysis with the binary mediator diabetes (yes or no) for the Jackson Heart Study data. Figure 2A and 2B show the maximum likelihood estimates of the natural indirect effect IE(x)RD and the natural direct effect DE(x + 1)RD on the risk difference scale. Figure 2C and 2D show the maximum likelihood estimates of the natural indirect effect IE(x)OR and the natural direct effect DE(x + 1)OR on the odds ratio scale. The solid line represents the estimated natural direct and indirect effects, and the gray areas represent the 95% CIs from the delta method at each value of the sensitivity parameter ϕ.

