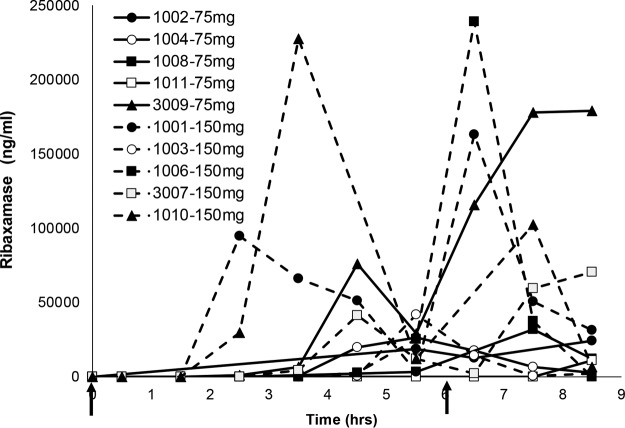
FIG 4.
Ribaxamase concentrations in intestinal chyme for ten subjects from period 2 of study 1. Serial chyme samples (as available) were collected and analyzed for their ribaxamase concentrations over time in period 2 of study 1. The data show individual concentration curves (assay LLOQ, 10 ng/ml) for 10 subjects (subject numbers are indicated in the figure) over time. Two doses of oral ribaxamase were administered (75 or 150 mg, as randomized and indicated on the figure) at the solid arrows. Missing data points indicate that no chyme was available for collection at that time point.

