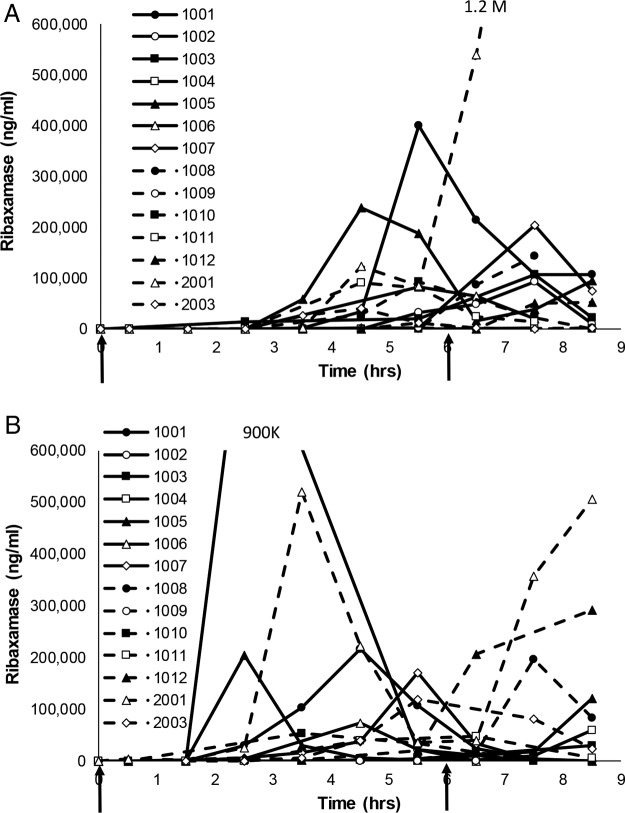
FIG 6.
Ribaxamase concentrations in intestinal chyme for fourteen subjects from study 2. Serial chyme samples (as available) were collected and analyzed for their ribaxamase concentrations over time in hours in periods 1 (A) and 2 (B) of study 2. The data show individual concentration curves (assay LLOQ, 10 ng/ml) for 14 subjects (subject numbers are indicated in the figure) over time. Two doses of oral ribaxamase were administered (150 mg/dose) at the solid arrows. Missing data indicate that no chyme was available for collection at that time point. Period 2 is when esomeprazole was present. Both graphs were truncated for clarity, and the numbers indicate the peak concentrations for the two subjects with truncated profiles.

