
FIG 2.
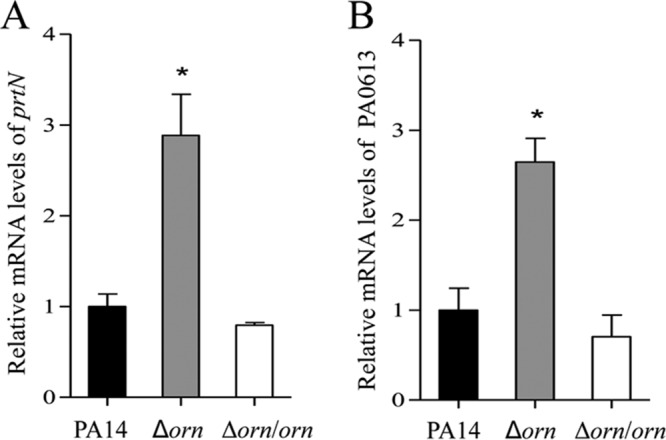
Expression levels of prtN and PA0613. The relative levels of prtN (A) and PA0613 (B) mRNA in the indicated strains were determined by real-time PCR, with PA0668.1 serving as an internal control. The results shown represent data from three independent experiments with similar results. Error bars represent standard deviations. *, P < 0.05 compared to PA14 or the complemented strain by Student's t test.