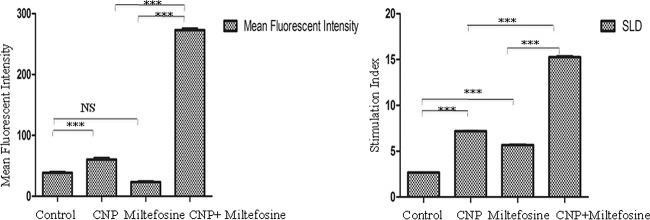
FIG 6.
Phagocytosis and lymphocyte proliferation assay. PECs from different treatment groups were isolated after animal euthanasia. (Left) Phagocytosis assay. Cells were stimulated with FITC-labeled bacteria and incubated for 1 h. The mean fluorescence signals of stimulated and unstimulated cells of each group were compared. (Right) Lymphocytes were induced with specific SLA at 10 μg/ml each. Proliferation is represented as the ratio of the mean OD of the stimulated culture to that of the unstimulated control. Each bar represents pooled data (mean ± the SD) for six hamsters, and the data represent the means of triplicate wells ± the SD. The significance of the activities of different treated groups was assessed against untreated (control) animals by using Bonferroni's test. ***, P < 0001. CNP, Eudragit-coated nanoformulation of curcumin.

