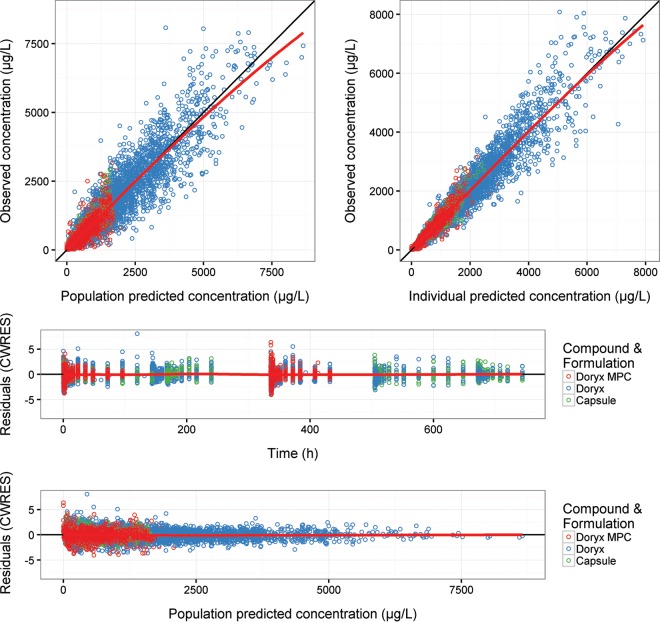
FIG 2.
Diagnostic plots for doxycycline concentrations following Doryx MPC (red), Doryx tablet (blue), and Doryx capsule (green) administration from the final model. Symbols are data points, the solid black line is a line of identity with slope 1 or 0, and the red lines are a loess-smooth of the data. CWRES, conditional weighted residuals.

