
FIG 3.
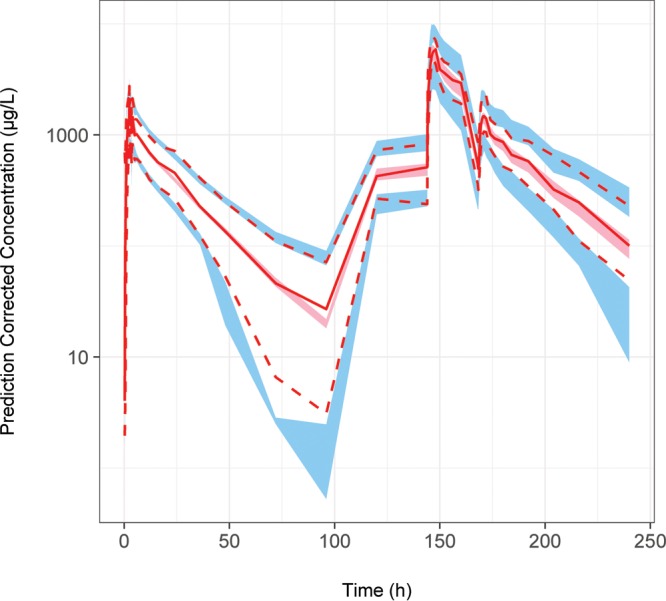
pcVPC of the final model for doxycycline concentrations. The prediction-corrected observed data are represented by the red solid line (median) and the red dashed lines (5th and 95th percentiles). The simulated prediction-corrected doxycycline concentrations are represented by the red shaded area (empirical 95% confidence interval of median) and the blue shaded areas (empirical 95% confidence intervals of 5th and 95th percentiles). The model predictions overlay the observed data with good agreement.