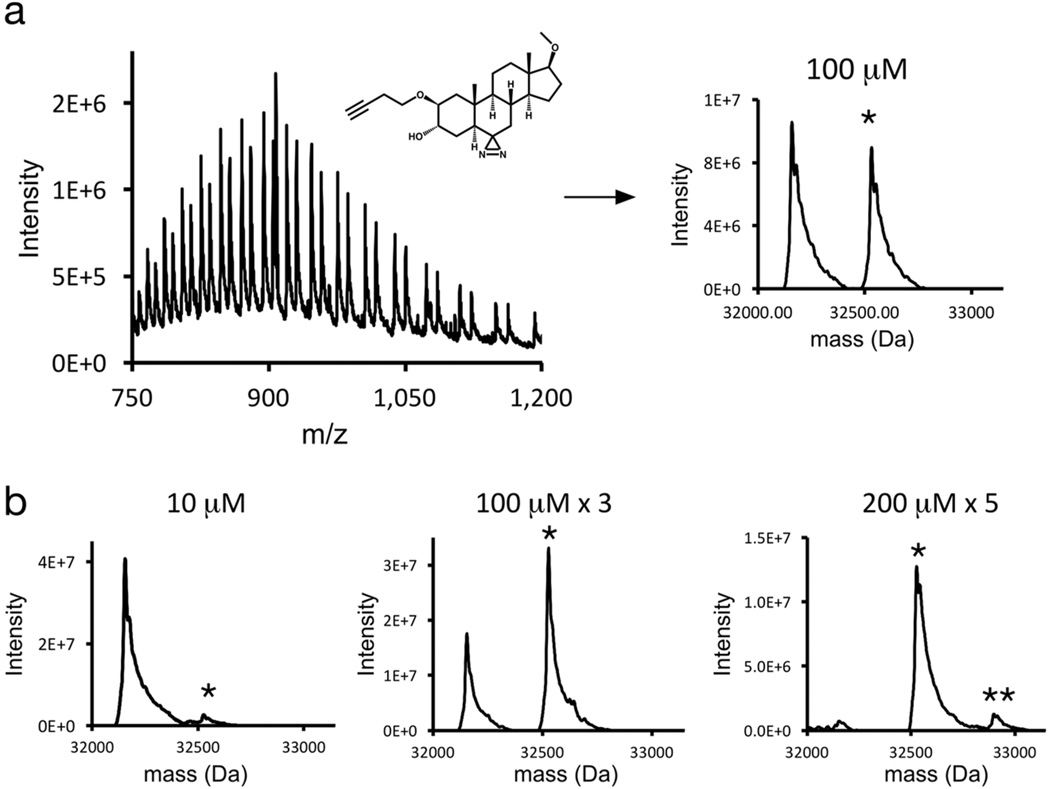
Figure 7.
Top-down mass spectrometry of KK123-labeled mVDAC1. A) Spectrum of intact mVDAC1 photolabeled with 100µM KK123. Deconvolution of the full spectrum reveals two predominant species corresponding to mVDAC1 and mVDAC1 labeled with a single KK123. Asterisks indicate number of KK123 molecules labeling mVDAC1. B) Deconvoluted spectra of mVDAC1 photolabeled at the indicated concentrations and number of times.

