
Fig. 2.
Generation of test images. Von Mises distributions (a, c, e) were converted into binary images (b, d, f) with known k and μ. Fiber alignment will increase with greater k values.
Official websites use .gov
A
.gov website belongs to an official
government organization in the United States.
Secure .gov websites use HTTPS
A lock (
) or https:// means you've safely
connected to the .gov website. Share sensitive
information only on official, secure websites.
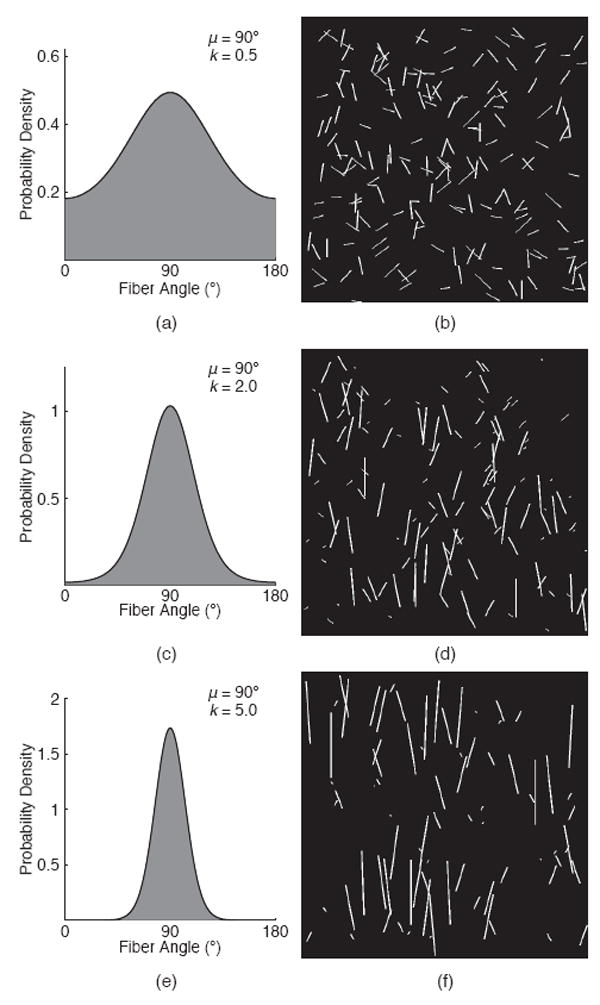
Generation of test images. Von Mises distributions (a, c, e) were converted into binary images (b, d, f) with known k and μ. Fiber alignment will increase with greater k values.