FIGURE 5:
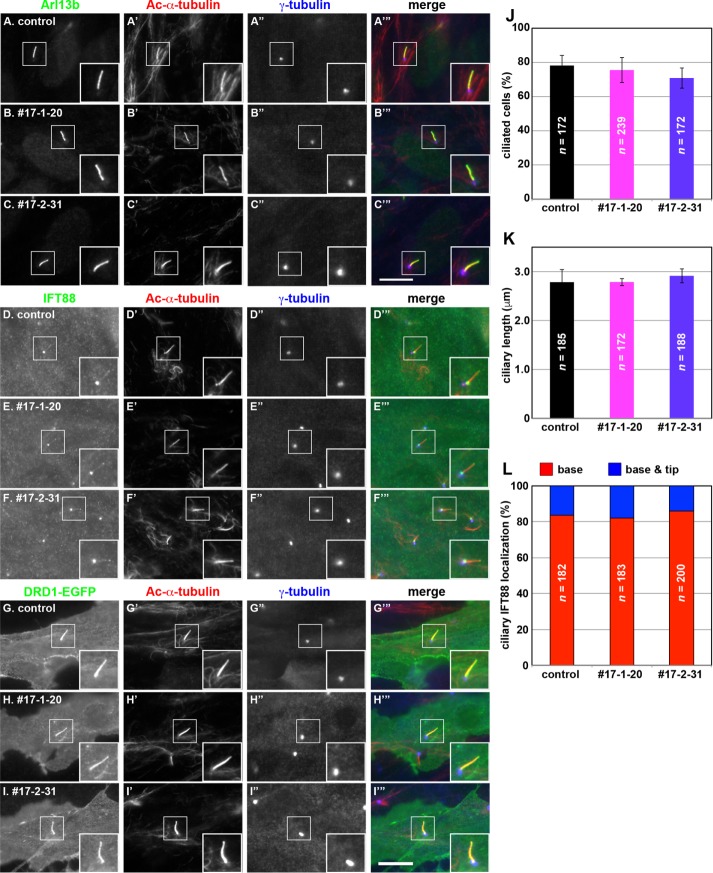
Localization of ciliary proteins in KIF17-KO cells. (A–F) Control RPE1 cells (A, D) and KIF17-KO cell lines 17-1-20 (B, E) and 17-2-31 (C, F) were cultured under serum starvation conditions for 24 h to induce ciliogenesis and triple immunostained for Arl13b (A–C) or IFT88 (D–F), Ac-α-tubulin (A′–F′), and γ-tubulin (A′′–F′′). (G–I) Control RPE1 cells (G) and KIF17-KO cell lines 17-1-20 (H) and 17-2-31 (I), which stably express DRD1-EGFP (G–I) and were established by infection of a lentiviral expression vector, were cultured under serum starvation conditions and immunostained for Ac-α-tubulin (G′–I′) and γ-tubulin (G′′–I′′). Merged images are shown in A′′′–I′′′. Insets, enlarged images of the boxed regions. Scale bar, 10 µm. (J) Ciliated control and KIF17-KO cells were counted; percentages of ciliated cells. Values are means ± SE (error bars) of three independent experiments. In each experiment, 55–81 cells were observed, and the total numbers of cells observed (n) are shown. (K) Ciliary lengths (lengths of Ac-α-tubulin staining) of individual control cells and KIF17-KO cells were measured. Values are means ± SE (error bars) of three independent experiments. In each set of experiments, 54–69 ciliated cells were observed, and the total numbers of ciliated cells observed (n) are shown. (L), Localization of IFT88 in individual control and KIF17-KO cells was classified as “ciliary base,” “ciliary tip,” and “base and tip” and counted. The percentages of these populations are expressed as stacked bar graphs. In each set of experiments, 55–71 ciliated cells were observed, and the total numbers of ciliated cells observed (n) are shown. Note that cells with IFT88 signals at only the ciliary tip were not observed.

