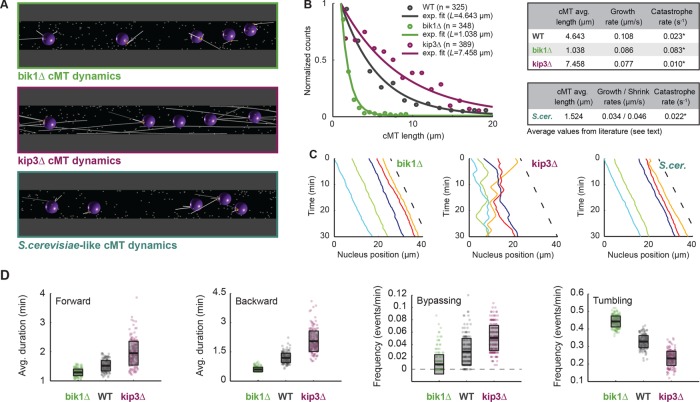
FIGURE 4:
Verification of nuclear-mobility phenotypes in mutants with altered cMT dynamics. (A) Snapshot of simulations with mutant cMT dynamics. The bik1Δ (top; green), kip3Δ (middle; magenta), and S. cerevisiae–like (bottom; dark turquoise) conditions. (B) Distributions of cMT length in WT, bik1Δ, and kip3Δ cells. Because, as shown by electron tomography, many cMTs are below the light microscopy resolution, only cMT length values (Grava and Philippsen, 2010) from 1 to 20 μm were used (n corresponds to the number of data point in this range). Frequency of each bin (circles) and an exponential fit on the truncated distribution (line; Fraile and García-Ortega, 2005). The corrected average cMT length, L, was determined. Data for WT are plotted in gray, for bik1Δ in green, and for kip3Δ in magenta. The tables summarize the determined catastrophe rates for WT and bik1Δ, kip3Δ, and S. cerevisiae–like mutants. The catastrophe rates were calculated (asterisk) by dividing the published cMT polymerization rate, vg, by L (see Results and Materials and Methods). (C) Plots of nuclear position along time in bik1Δ (left), kip3Δ (middle), and S. cerevisiae–like (right) simulations. The dashed line indicates the applied flow speed. (D) Box plots of nuclear dynamics measurements in “wild-type” and “mutant” simulations. Average duration of forward movements (left), average duration of backward movements (middle left), frequency of bypassing events (middle right), and frequency of tumbling events (right). Simulations representing “bik1Δ,” “WT,” and “kip3Δ” cells are plotted in green, gray, and magenta, respectively. Circles stand for individual simulations; the thick black line marks the average value, and the transparent gray box represents the SD.

