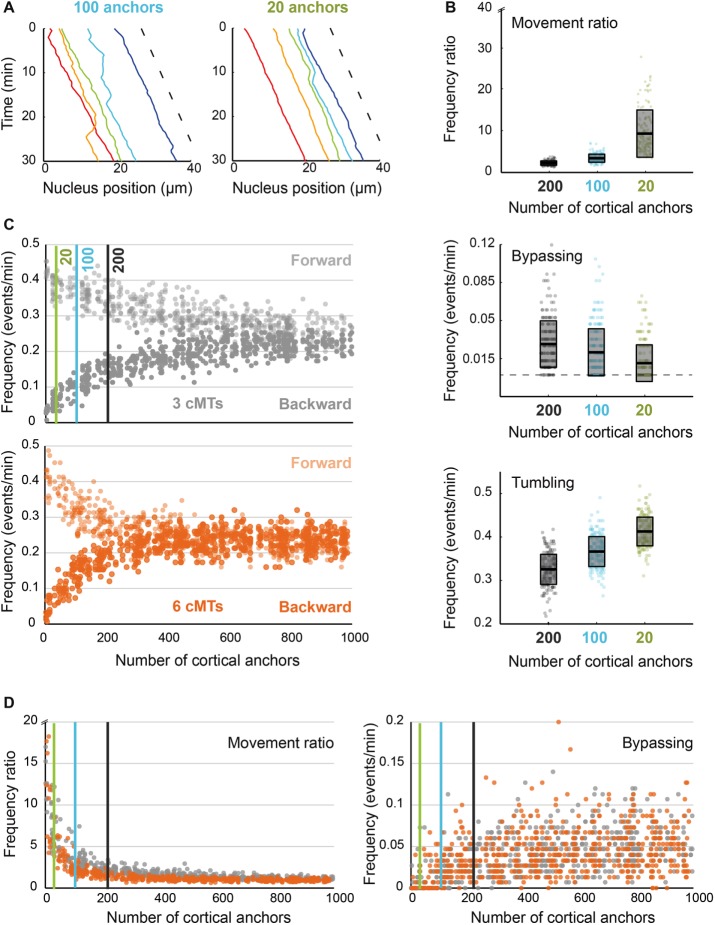
FIGURE 5:
Importance of anchor density at the cell cortex. (A) The position of five nuclei along time in simulations containing 100 (left) and 20 (right) cortical anchors per 30 μm of hypha. The dashed line indicates the applied flow speed. (B) Quantification of nuclear movements in simulations with 200 (“wild-type”), 100, and 20 cortical anchors. Ratio of forward/backward movement frequencies (top), frequency of bypassing events (middle), and frequency of tumbling events (bottom). The dots stand for individual simulations, and the box indicates the mean and SDs. Results obtained with 200, 100, and 20 anchors are plotted in gray, turquoise, and lime green, respectively. (C) Frequencies of forward (lighter) and backward (darker) movements as a function of the number of anchors, with three cMTs (gray; top) or six cMTs (orange; bottom) per nucleus. Each vertical line at 20, 100, and 200 marks the position of the parameter values used in B. (D) Ratio of forward/backward movement frequencies (left) and frequencies of bypassing events (right) as a function of anchor density for three cMTs (gray) and six cMTs (orange). The three vertical lines mark the position of the parameter values used in B.

