FIGURE 6:
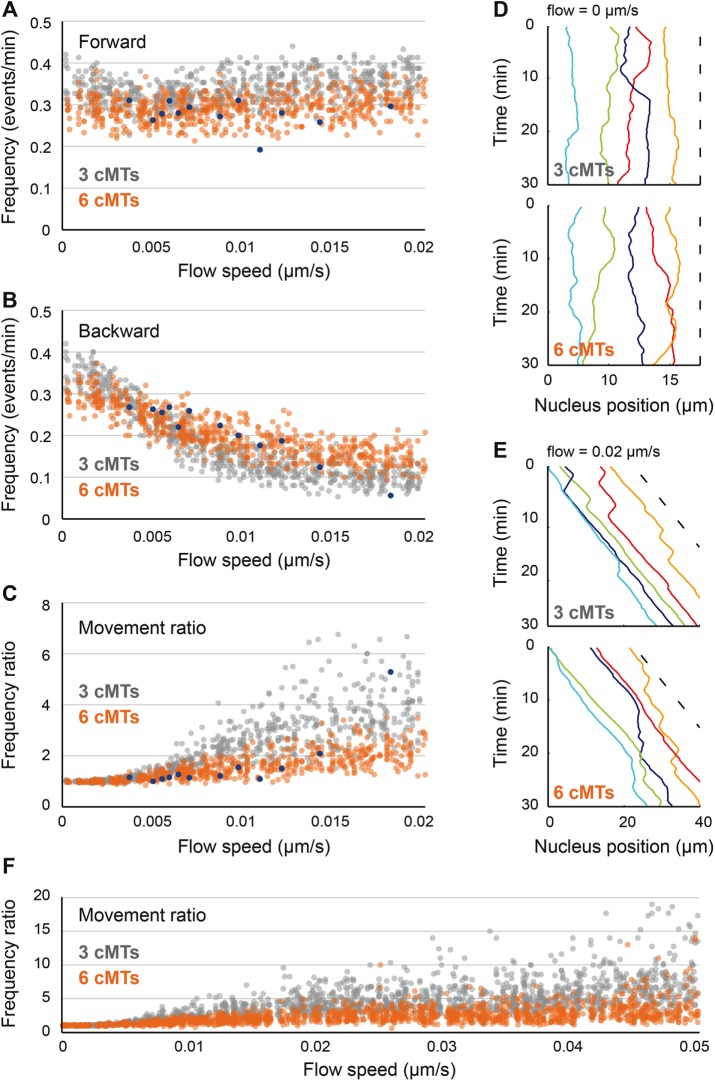
Influence of cytoplasmic flow on nuclear movements and role of cMT number in movement balance. (A) The frequency of forward movements as a function of increasing cytoplasmic flow (from 0 to 0.02 μm/s). Simulation values are plotted in gray (three cMTs per nucleus) and orange (six cMTs per nucleus) and experimental values in blue. (B) Plot of the frequency of backward movements as a function of increasing cytoplasmic flow (from 0 to 0.02 μm/s). Colors as in A. (C) The ratio of movement frequencies (forward/backward) as a function of increasing cytoplasmic flow (from 0 to 0.02 μm/s). Colors as in A. (D) Simulated nuclear positions along time without flow (speed of 0 μm/s). The x-coordinates of the center of individual nuclei (1–5) are plotted in different colors, and the dashed line indicates the applied flow speed. Top, example of a simulation with three cMTs. Bottom, example of a simulation with six cMTs. (E) Simulated nuclear positions along time with a flow speed of 0.02 μm/s. Same explanation as D. (F) The ratio of movement frequencies (forward/backward) as a function of increasing cytoplasmic flow (from 0 to 0.05 μm/s). Colors as in A.

