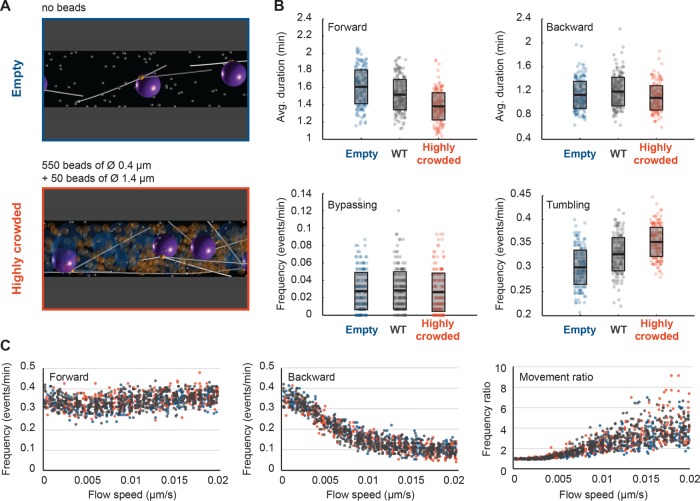
FIGURE 7:
Influence of organelle crowding on nuclear dynamics. (A) Snapshots of simulations with uncrowded and highly crowded cytoplasm. To represent the “wild-type” (WT) situation, the simulation included 550 “mitochondria” spheres of 0.4 μm diameter and 50 “vacuole” spheres of diameter 0.6 μm. These objects are removed in the uncrowded, empty case (top), and in the highly crowded case (bottom), the 50 “vacuoles” were enlarged to a diameter of 1.4 μm. (B) Box plots of nuclear dynamics measurements comparing the simulated “WT” situation to “empty” and “highly crowded” simulations. Average duration of forward movements (top left), average duration of backward movements (top right), frequency of bypassing events (bottom left), and frequency of tumbling events (bottom right). The “empty,” “WT,” and “highly crowded” data are plotted in blue, gray, and orange, respectively. Circles stand for individual simulations; the thick black line marks the average value, and the transparent gray box represents the SD. (C) Plots of the frequencies of forward (left) and backward (middle) movements and their ratio (right) as a function of increasing cytoplasmic flow (from 0 to 0.02 μm/s). Colors as in B.

