FIGURE 3:
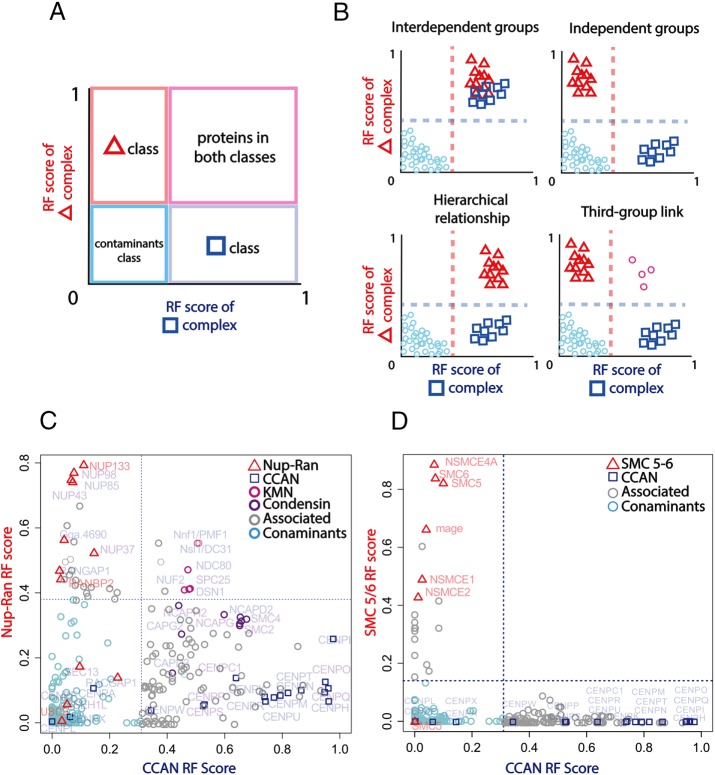
Known and novel interdependences among complexes revealed by RF. Highest separation quality thresholds are depicted by dashed lines. (A) A 2D diagram to visualize intersections between RF results for different complexes. Proteins above both thresholds (pink quadrant) associate with both complexes, whereas those above only one remain independent. (B) Possible scenarios of interdependence between complexes inferred from 2D RF plots. A hierarchical effect (bottom left) occurs when the RF of one complex (squares) brings up the other complex (triangles) but not vice versa. A third-group link (bottom right) is equivalent to a double hierarchical effect on the pink circle complex. Many three-group relationships exist; in the case shown, the circle complex is the only link between the triangle and square complexes. (C, D) A 2D interdependence plot of the CCAN (C and D, squares) vs. the Nup107-160/RanGap complex (C, triangles) and the SMC 5/6 complex (D, triangles).

