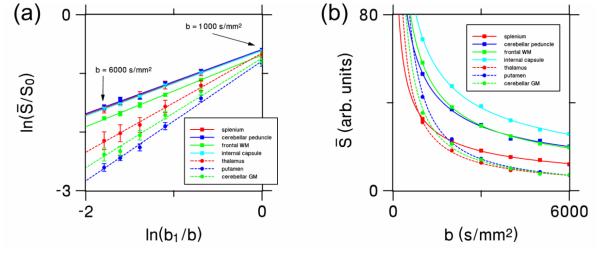
Figure 2.
(a) Log-log plot showing the relationship between the direction-averaged DWI signal from each ROI (normalized by dividing by the signal without diffusion weighting, S0) and the six b-values (1000, 2000, 3000, 4000, 5000 and 6000 s/mm2) for all the ROIs of Subject 1. The reference b-value b1 is set to 1000 s/mm2. The error bars show the standard deviations of the measurements. The fits to Eq. (1) for white and gray matter regions are indicated by solid and dashed lines, respectively. (b) Linear scale plot showing the same data, but without normalization and error bars in order to better demonstrate the quality of the fits. WM = white matter; GM = gray matter.

