
Figure 1. The TIRAP R121W mutation is a rare mutation affecting the TIR domain of TIRAP, with a modest impact at the mRNA and protein levels.
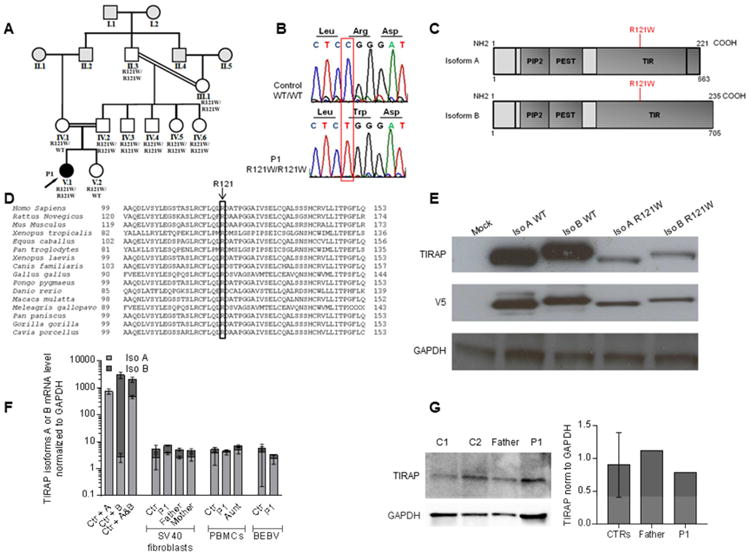
A. Pedigree of the kindred, with allele segregation. Each generation is identified with a roman numeral (from I to V), and each individual with an Arabic numeral (from left to right). The patient (P1) with clinical infectious disease is shown in black and indicated with an arrow. The relationships between individuals in gray were extrapolated according to the estimated kinship coefficients (Figure S1).
B. Electrophoregram of TIRAP genomic DNA sequences from a healthy control and the patient (V.1).
C. Schematic representation of TIRAP, showing the PIP2 domain, the PEST domain, the TIR domain and the coding exons. The R121W mutation in the TIR domain is indicated in red.
D. Conservation of the R121 amino acid in the TIR domain of TIRAP in 16 species.
E. HEK 293 T cells were transfected for 48 h with either TIRAP isoforms (A and B), in the WT form or with the R121W mutation. Western blot was performed on whole-cell extracts with a mouse monoclonal anti-TIRAP antibody and an anti-V5 tag antibody (n=3).
F. Reverse transcription-quantitative PCR was performed to determine the levels of the transcripts encoding TIRAP isoforms A and B in SV40 fibroblasts (from five controls, P1, P1's father and mother), PBMCs (from 9 controls, P1, and P1's aunt) and EBV-B cells (from 5 controls and P1). SV40 fibroblasts stably transfected with the cDNA encoding either isoform A or B were used as controls to test probe specificity. TIRAP mRNA levels encoding isoform A or B are expressed relative to GAPDH mRNA levels (2ΔΔC(t) method). For each probe, the results were normalized relative to one of the controls, for which the value had been set to 1. Error bars show SD (n=2).
G. TIRAP protein levels in PBMCs from two controls, P1's father and P1, as determined by western blotting with an anti-TIRAP mouse mAb. Image J software was used for quantification (n=1). Error bars show SD