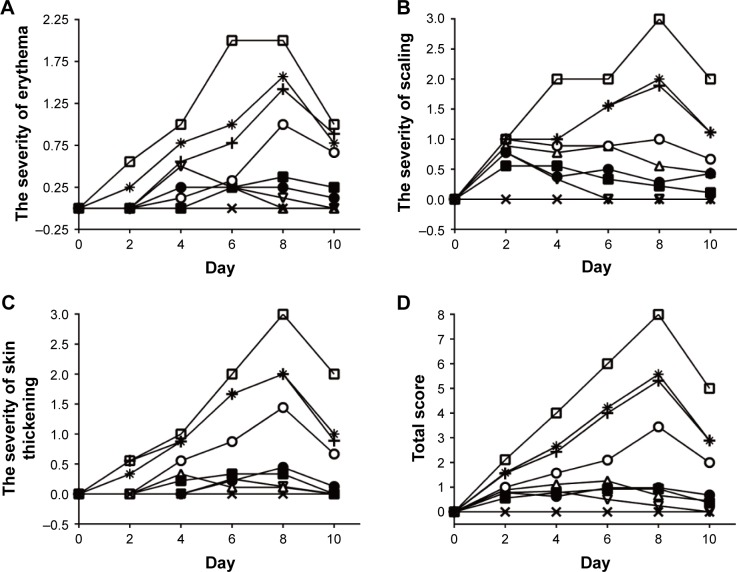
Figure 2.
The severity of each psoriatic symptom; erythema (A), scaling (B), skin thickening (C), and total score (D) over time.
Notes: The severity of each psoriatic symptom was evaluated with the PASI score of psoriatic dorsal regions of mouse. Scoring was performed on days 0, 2, 4, 6, 8, and 10, based on the erythema, scales, and thickness of PASI; each symbol represents the mean ± SD of nine animals. Each symptom was assigned a score of 0–4 as follows: 0, none; 1, slight; 2, moderate; 3, marked; and 4, very marked. The total score was the sum of erythema, scaling, skin thickening. (×= control group, □ = IMQ group, + = IMQ–vehicle group, * = IMQ–NIC group, ○ = IMQ–Protopic® group, ● = IMQ–FK506–NIC group, ■ = IMQ–FK506 NPs group, ∆ = IMQ–FK506 NPs–NIC group, and ∇ = IMQ–CP group).
Abbreviations: CP, clobetasol propionate; FK506, tacrolimus; IMQ, imiquimod; NIC, nicotinamide; NPs, nanoparticles; PASI, psoriasis area severity index.

