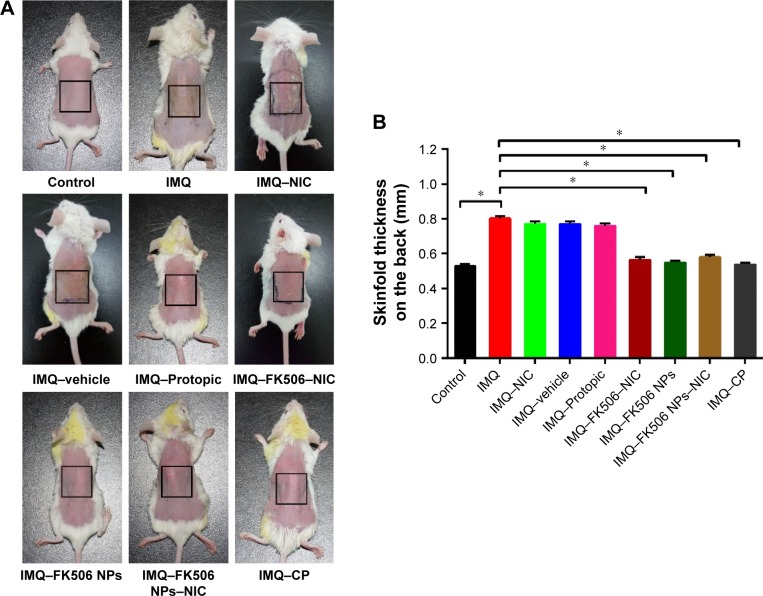
Figure 3.
Representative photography of mouse after 8 days treatment with different formulations (A) and skinfold thickness measurement (B).
Notes: Each bar represents the mean ± SD of nine determinations. Significant differences were calculated using the ANOVA test (*P<0.05). The concentration of FK506 in each formulation was 1 mg/mL.
Abbreviations: ANOVA, analysis of variance; CP, clobetasol propionate; FK506, tacrolimus; IMQ, imiquimod; NIC, nicotinamide; NPs, nanoparticles; SD, standard deviation.

